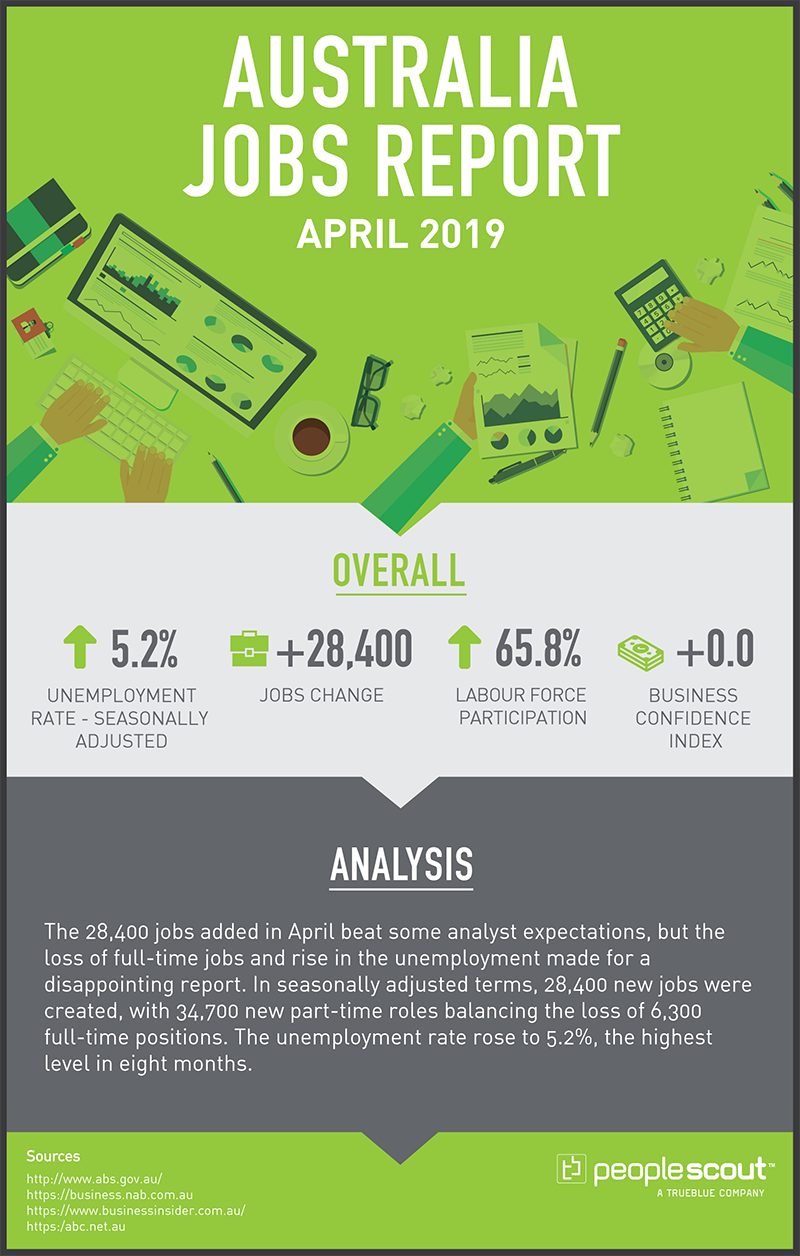
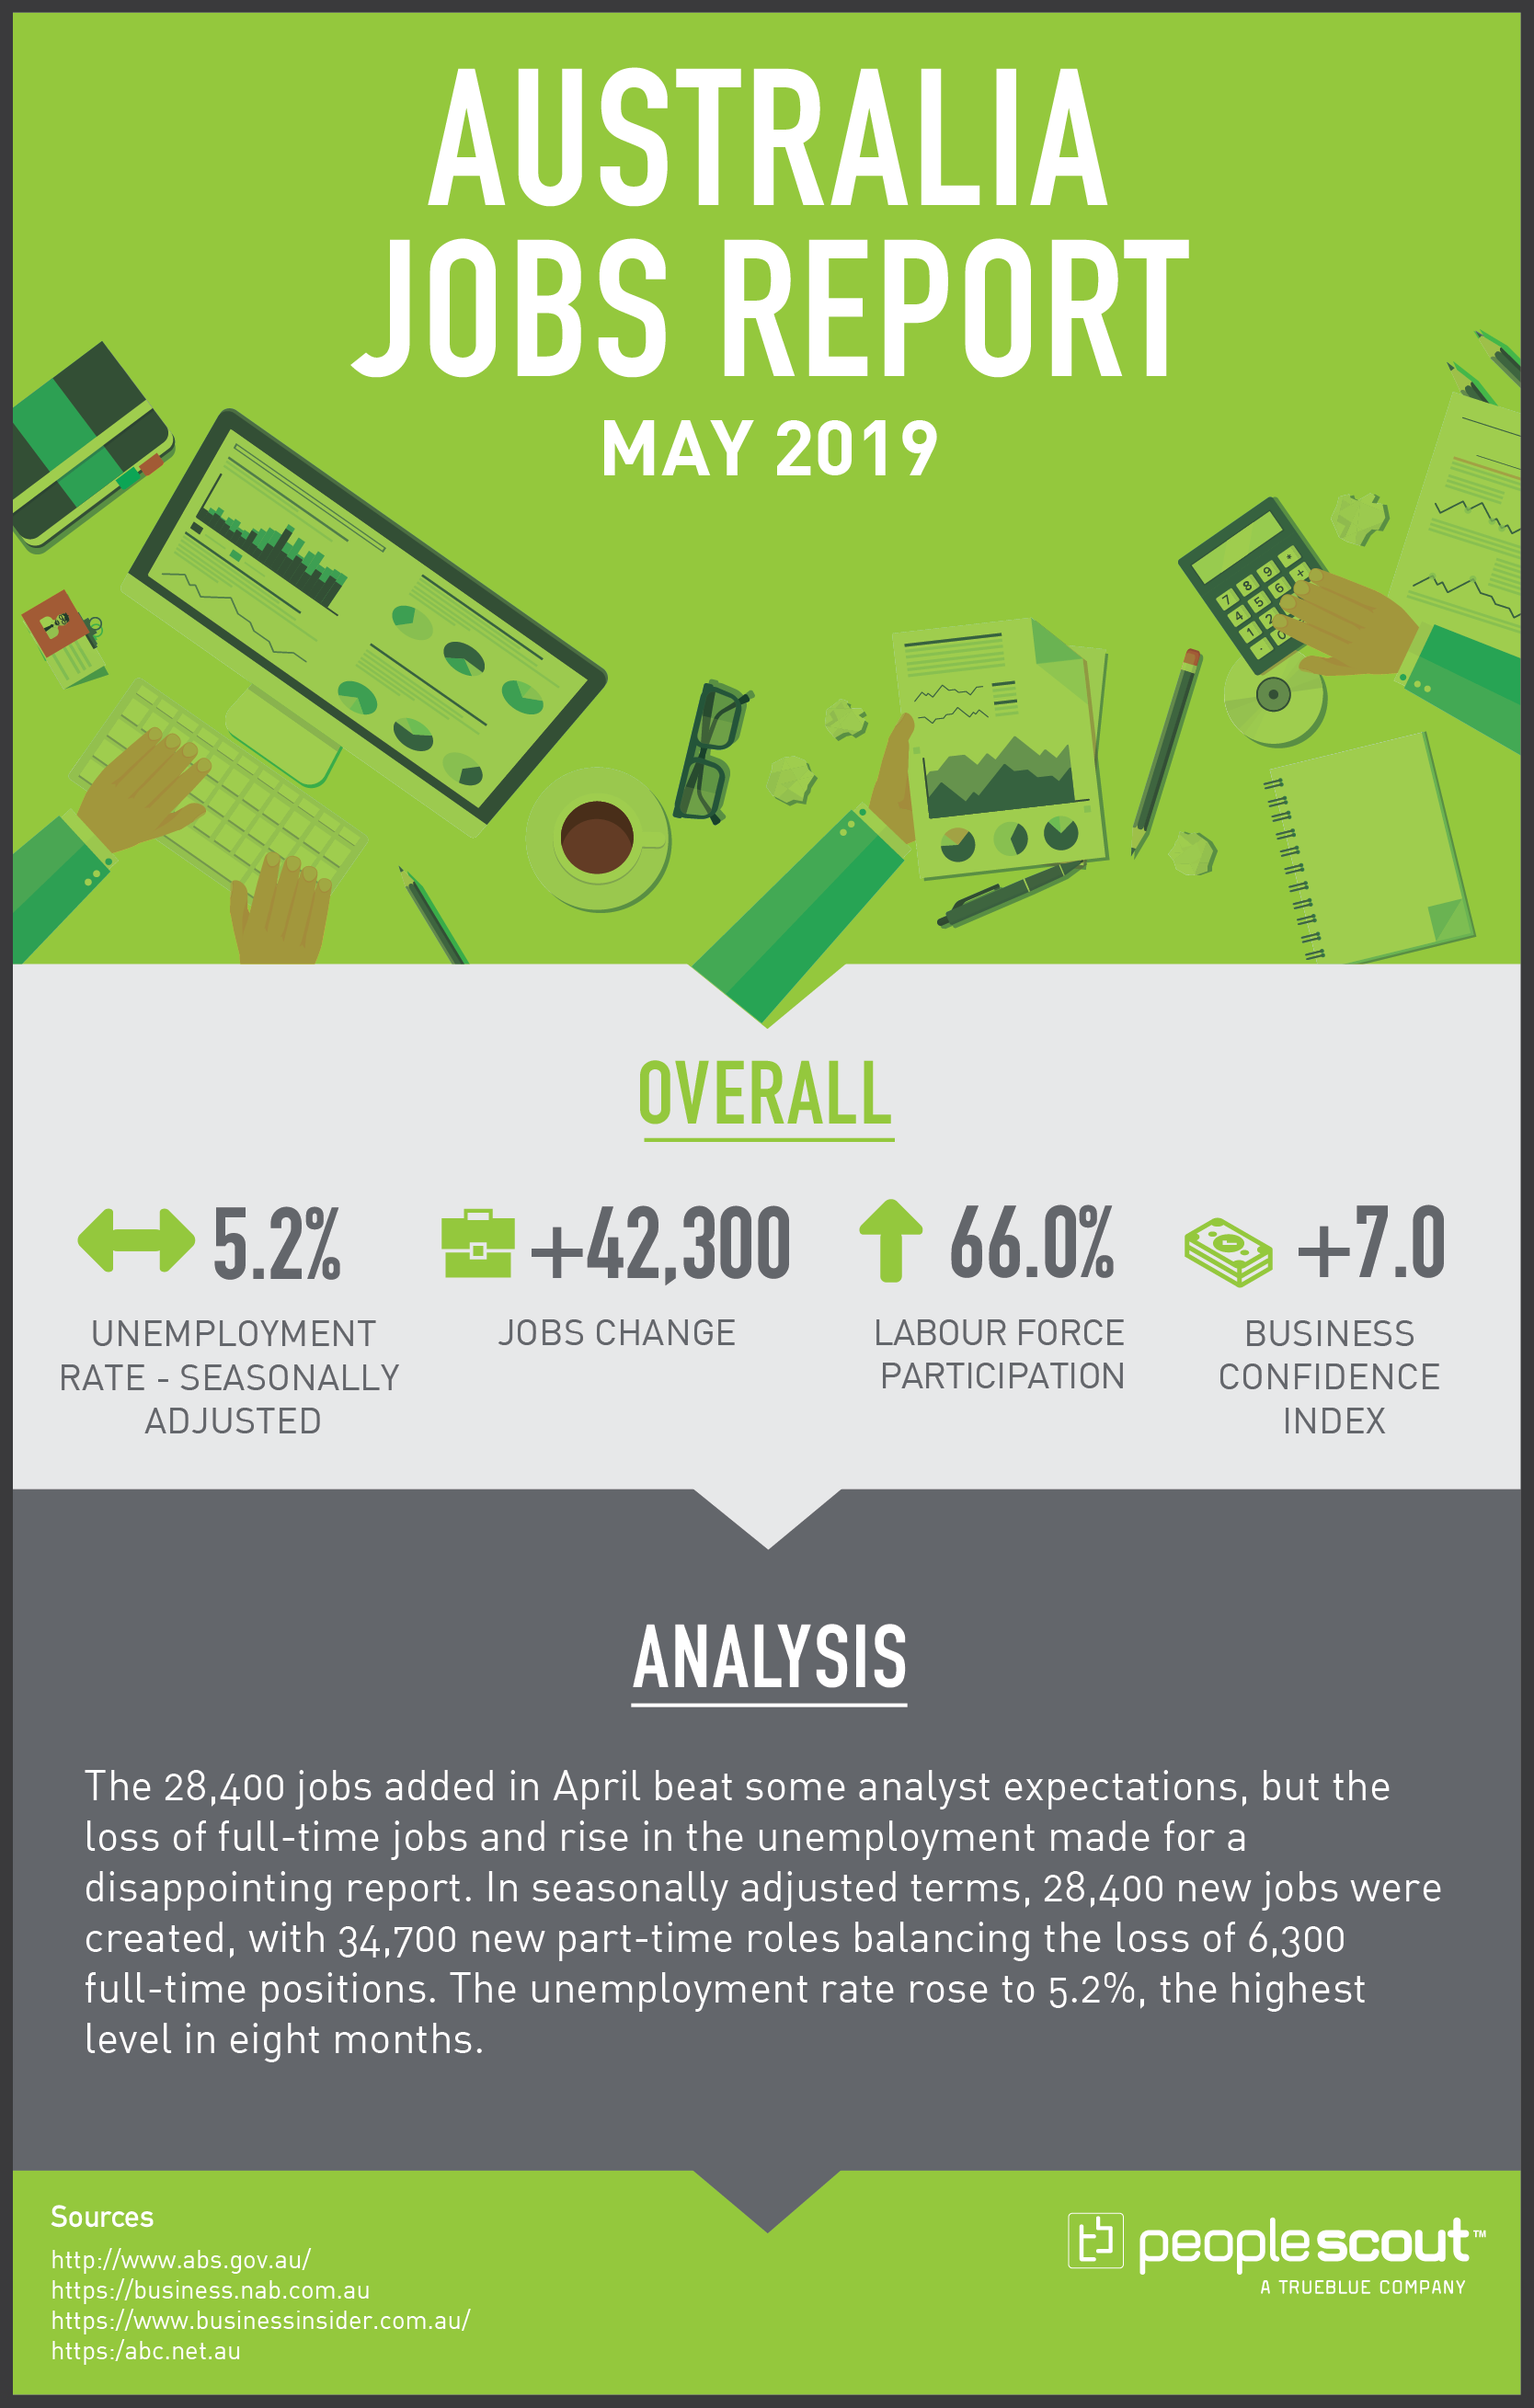
The 28,400 jobs added in April beat some analyst expectations, but the loss of full-time jobs and rise in the unemployment made for a disappointing report. In seasonally adjusted terms, 28,400 new jobs were created, with 34,700 new part-time roles balancing the loss of 6,300 full-time positions. The unemployment rate rose to 5.2%, the highest level in eight months.
Upside
The Australian economy added 42,300 jobs in May. The labour force participation rate rose to 66.0%, reaching a record high level for the second month in a row. The business confidence index increased to +7, just above the long-term average. Since May 2018, full-time employment increased by 266,300, while part-time employment increased by 93,900.
The largest increase in employment was in New South Wales (up 38,500), followed by Victoria (up 28,600) and Queensland (up 7,800).
Downside
The job growth was almost entirely due to part-time positions. The full-time job increase was just 2,400, much lower than the addition of 39,800 part-time positions. The unemployment rate held steady at 5.2% due to the increase in the participation rate. When the unemployment rate rose in April, it reached its highest level in eight months.
The underemployment rate increased one-tenth of a percentage point to 8.6%. Underemployed workers are defined as part-time workers who want to work more hours than they are and are available to do so as well as full-time workers who worked part-time hours for economic reasons.
Even the robust growth in part-time jobs may not be an indicator of continued job increases but a result of the recent national elections:
“CommSec chief economist Craig James said the data covered the federal election period and may account for the skew to part-time workers.
‘Clearly there are temporary jobs created each three years for election-related roles,’ Mr. James said.”
Western Australia had a net job loss of 4,000 and Tasmania had a decrease of 400 positions.
How Long Will the Confidence Last?
While the business confidence index rose in the latest release, business conditions and other key indices were weak clouding the economic outlook:
“’Business confidence saw a post-election spike in May,’ said NAB Group Chief Economist Alan Oster. Interviewing for the survey started on May 20, two days after a federal election saw the Coalition government returned to power.
‘Expectations of rate cuts may also have helped.’
There had been mounting speculation last month that the Reserve Bank of Australia (RBA) would soon cut interest rates, which it duly did at its June 4 policy meeting.
‘While confidence, at least at face value was a positive outcome, business conditions deteriorated further,’ cautioned Oster. ‘Trading conditions and profits are particularly weak.’
The survey’s measure of trading, or sales, slipped 5 points to +3, while profitability fell 4 points to -3. Forward orders also dropped a point to -3.
‘Forward-looking indicators suggest that the bounce in confidence is likely to be short-lived and that conditions are unlikely to turn around any time soon,’ said Oster.”