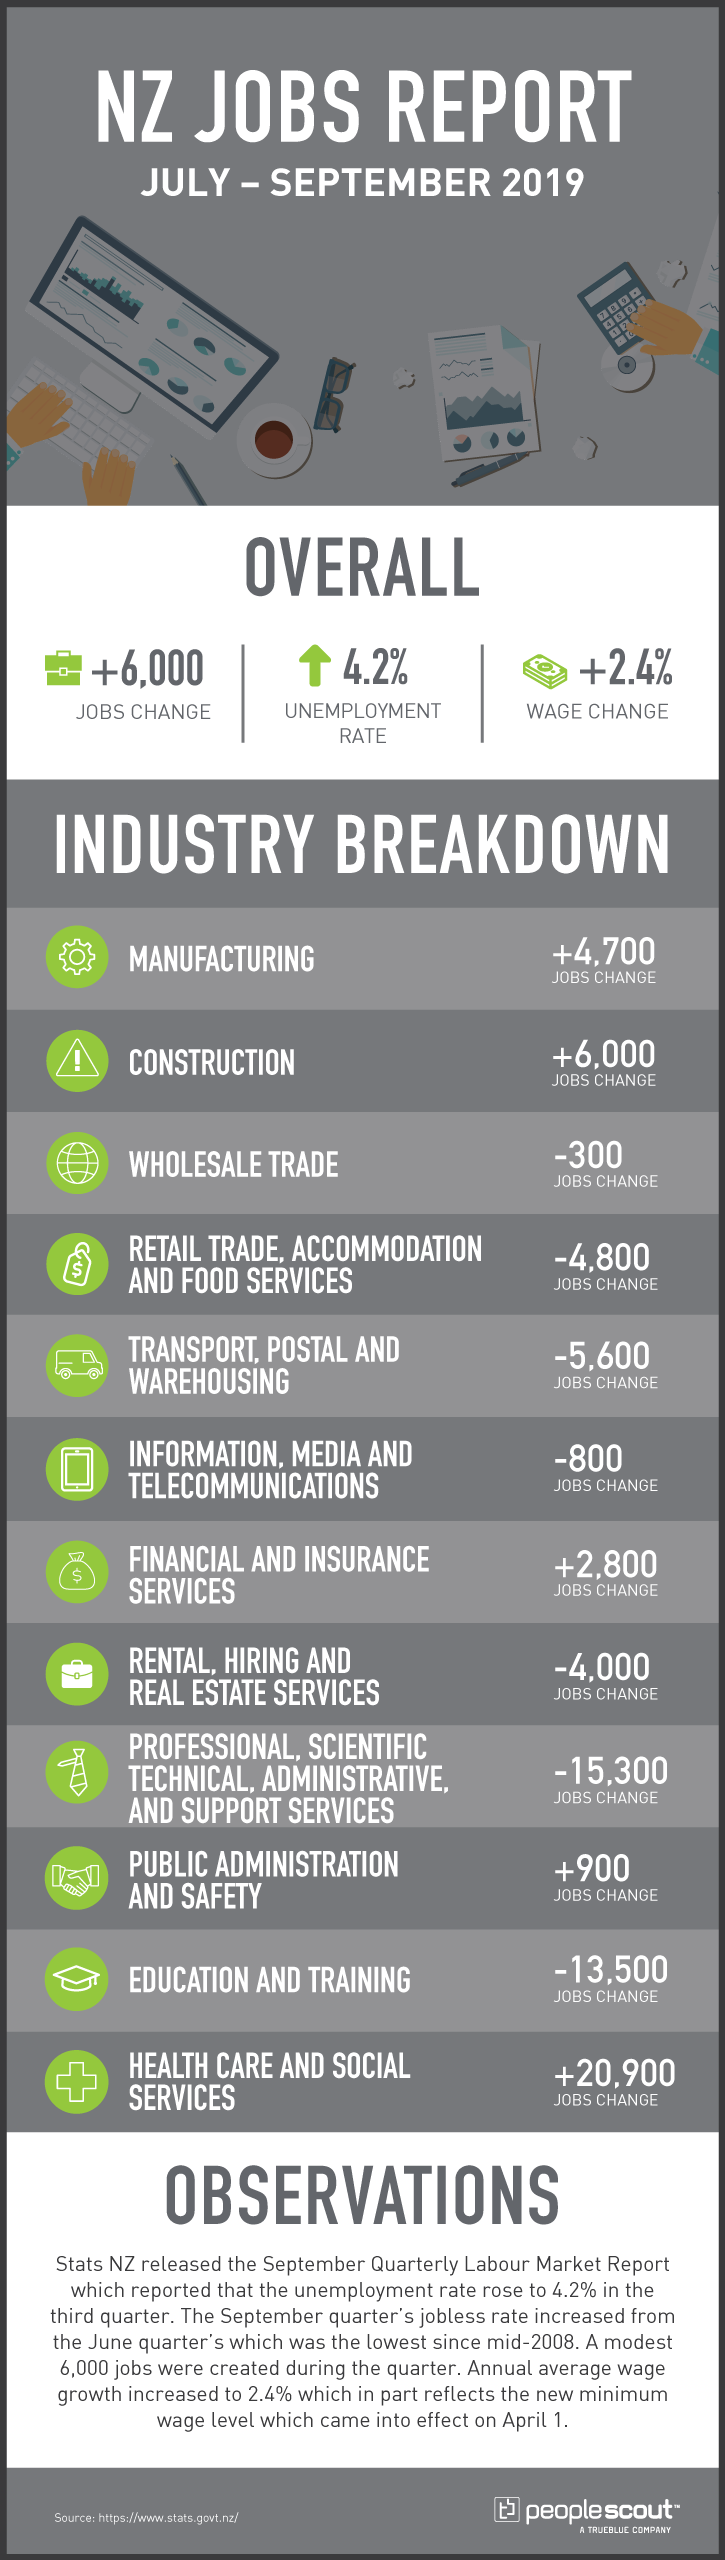
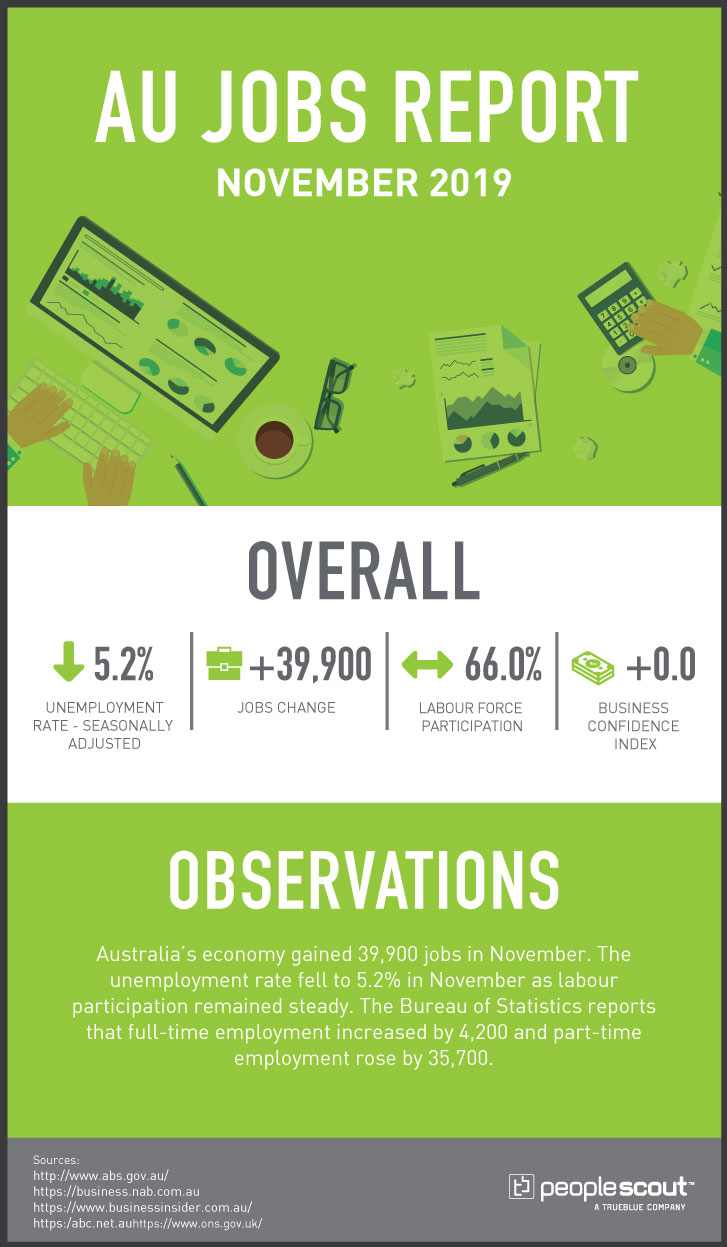
PeopleScout Australia Jobs Report Analysis – April 2019

The 28,400 jobs added in April beat some analyst expectations, but the loss of full-time jobs and rise in the unemployment rate made for a disappointing report.

April 2019 (May Report)  Unemployment rate – Seasonally Adjusted: 5.2 percent (Up Arrow) Jobs Change: + 28,400 Labour Force Participation: 65.8 per cent (Up Arrow)   Business Confidence Index: 0 (Down Arrow)  Sources:  http://www.abs.gov.au/ https://business.nab.com.au https://www.businessinsider.com.au/ https:/abc.net.au   Summary:   The 28,400 jobs added in April beat some analyst expectations, but the loss of full-time jobs and rise in the unemployment made for a disappointing report. In seasonally adjusted terms, 28,400 new jobs were created, with 34,700 new part-time roles balancing the loss of 6,300 full-time positions. The unemployment rate rose to 5.2%, the highest level in eight months.

The Numbers

28,400: The Australian economy added 28,400 jobs in April.

5.2%: The Australian unemployment rate rose to 5.2%.

65.8%: Labour force participation rose to 65.8%.

0: The Business Confident Index fell to 0 from our last update in the latest NAB release.

Upside

The Australian economy added 28,400 jobs in April, beating analyst expectations. The labour force participation rate rose to 65.8%, a record high showing broad confidence in the nation’s job market. Since April 2018, full-time employment increased by 248,100 and part-time employment increased by 74,800.

States with job growth include New South Wales (up 25,100), followed by Western Australia (up 6,400) and Queensland (up 5,400).

Downside

The job growth was entirely due to part-time positions. The 34,700 new part-time roles balanced the loss of 6,300 full-time jobs. The unemployment rate rose to 5.2%, the highest level in eight months.  Victoria had a net job loss of 7,600. The nation’s youth unemployment – people aged between 15 and 24, rose 0.1 points higher to 11.8%.

Another troubling indicator is the increase in the underutilisation rate which went from 13.3% to 13.7% in one month. Underutilisation includes unemployed Australians and those working who want to work more.

The data released in the report, coupled with the news that online job ads have fallen to six-year lows have led some analysts, including RBC’s Richard Thompson, to assert that the unemployment rate is not likely to fall any time soon:

“Given the suite of lead employment/vacancy indicators mostly suggesting further softening in labour market conditions ahead, it is difficult to imagine that unemployment will get back below the 5% mark.”

Fall in Online Job Ads – A Negative Indicator?

Business Insider Australia reports that job advertisements placed on employment platform SEEK fell 8.9% annually in April. Postings fell in all job categories and in all states except the Australian Capital Territory. Ads in media, trades, construction, real estate and architecture fell more than 20% over the year. Job ads in 15 categories fell more than 10%. The article notes, “if the data is reflective of a broader demand for workers, it isn’t looking good for anyone seeking employment in the second half of the year.”

A decrease in online job postings does not necessarily indicate a softening job market. In May 2018, online job ads decreased by 51,000 in the U.S. when the unemployment rate stood at 3.8%. Nearly one year later, in April 2019, it was 3.6%. A decrease in the number of online job postings may reflect, at least in part, that enterprises are successfully utilizing creative strategies to attract talent beyond traditional job boards.

PeopleScout UK Jobs Report Analysis – May 2019

The May 2019 Labour Market Report released by the Office for National Statistics which covers the first quarter of 2019. The unemployment rate dropped to 3.8%, its lowest level since 1974. In that period, 99,000 jobs were added to the UK economy, which was lower than some analysts had projected. Nominal wages rose by 3.3% over the year.

May 2019  UK Labour Market Reports are based on moving three-month (quarter) data for the period ending two months prior. The May Report includes the quarter spanning January 2019 - March 2019.  This month’s report does not include updates on job changes by industry.  Jobs Added – Chart 1 Unemployment – Chart 1 Wages – Chart 15  OVERALL  Overall Jobs Added in Quarter: +99,000 Overall Unemployment Rate: 3.8 percent (Down arrow) Overall Wage Change: +3.3 per cent   INDUSTRY BREAKDOWN (Job change not updated in this release)  Manufacturing Jobs Change in Quarter: -11,000 Percent Change Over One Year:  -1.0%  Wholesale/Retail/Vehicle Repair Jobs Change in Quarter: +3,000 Percent Change Over One Year:  -0.5%  Transport and Storage Jobs Change in Quarter: +58,000 Percent Change Over One Year:  +5.1%  Accommodation and Food Service Jobs Change in Quarter: +35,000 Percent Change Over One Year:  +3.7%  Information and Communication Jobs Change in Quarter: +3,000 Percent Change Over One Year:  +6.0%  Financial and Insurance Jobs Change in Quarter: -6,000 Percent Change Over One Year:  +0.4%   Professional, Scientific and Technical Jobs Change in Quarter: +48,000 Percent Change Over One Year:  +2.0%  Administrative and Support Services Jobs Change in Quarter: -19,000 Percent Change Over One Year:  -0.9%  Education Jobs Change in Quarter: +15,000 Percent Change Over One Year:  +1.9%  Human Health and Social Work Jobs Change in Quarter: +0 Percent Change Over One Year:  +1.1%   Year over Year Wage Changes (Updated in this Release) Whole Economy:  +3.3% Private Sector:  +3.5% Public Sector:  +2.3% Services:  +3.4% Finance and Business Services:  +3.9% Public Sector excluding Financial Services:  +2.4% Manufacturing: +2.2% Construction: +3.9% Wholesaling, Retailing, Hotels & Restaurants: +2.6%  Overview  The Office for National Statistics released its May Labour Market Report which reports on the first quarter of 2019. Compared with a year earlier, regular wages excluding bonuses were up by 3.3%, lower than last month’s report. The employment rate rose to 76.1%, the highest level since comparable records have been tracked in 1971. Unemployment dropped to 3.8% and has not been lower since 1974.

The Numbers

The UK employment rate was estimated at 76.1%, which is higher than the previous year (75.6%) and tied for the highest figure on record.

Estimates for the first quarter of 2019 show 32.70 million employed people who are 16-years-old and over, which is 354,000 more than for a year earlier. This increase is due entirely to an increase in full-time workers. Part-time workers decreased by 18,000 on the year to reach 8.59 million.

The UK unemployment rate was estimated at 3.8%; it has not been lower since October to December 1974.

The UK economic inactivity rate was estimated at 20.8%, lower than a year earlier (21.1%) and close to a record low. Economic inactivity measures people without a job but who are not classed as unemployed because they have not been actively seeking work within the last four weeks and/or they are unable to start work within the next two weeks.

For February to April 2019, there were an estimated 846,000 vacancies in the UK, 28,000 more than a year earlier. Job vacancies are reported on a different schedule than most of the other labour market figures.

Solid Job Numbers, but Lower Than Expected

The addition of nearly 100,000 jobs to the economy is good news by any standard. Yet many economists were expecting even greater increases, and there was speculation about the slowing rate of growth for both jobs and wages. Uncertainty over Brexit is still lurking in the background, as Reuters reports:

“The jobs boom may well reflect how employers have opted to take on workers – who can be laid off quickly during a downturn – rather than commit to longer-term investments while they wait for uncertainty over the conditions of Britain’s departure from the European Union to lift.”

Trouble Ahead?

The idea that employers are choosing to hire expendable workers rather than make long-term capital investments does not suggest confidence in the nation’s economic outlook. Some economists quoted in the Financial Times found some of the data from the May report to be a cause for concern:

“’Britain’s job market continues to defy wider economic uncertainty,’ said Stephen Clarke, senior economic analyst at the Resolution Foundation…

The number of jobs added in the first three months to March was below expectations and lower than the number added in the three months to February. While the number of self-employed increased, the number of full-time employees dropped by 55,000 compared with the previous quarter.

‘Some tentative early warning signs suggest that the jobs market is entering a turbulent period,’ warned James Smith, an economist at ING.

Surprising Growth in the Number of EU Workers

The first quarter of 2019 may well be remembered as a time when Brexit was the dominant topic in every part of the country. Workers for EU countries residing in the UK faced an uncertain future as the original Brexit date loomed. Last year, the ONS reported significant numbers of EU workers leaving the UK in a trend that was nicknamed “Brexodus.”

Yet during this same time, the number of EU nationals working in the UK reached a record high. Nearly 2.4 million citizens of other EU countries now work in the UK, an increase of more than 100,000 compared to the final three months of 2018.

For employers, unexpected shifts such as the reversal of Brexodus underscore the need for expertise in attracting and retaining talent in the uncertain months ahead.


PeopleScout Canada Jobs Report Analysis — April 2019

Statistics Canada reported that the nation’s unemployment fell to 5.7% and that 107,000 jobs were gained after shedding jobs in March. This is the biggest one month increase with records going back to 1976. The record job growth beat market expectations of an addition of just 12,000 jobs or less. Canada added 426,400 jobs over the past 12 months, up 2.3%, which is the largest one-year increase since 2007 before the Great Recession. In the last two years, the economy has added 700,000 jobs.

April 2019  OVERALL  Overall Jobs Gained/Lost:  +107,000 Overall Unemployment Rate: 5.7 per cent (Down arrow) Overall Weekly Wage Change: + 2.1 per cent (Down arrow)  INDUSTRY BREAKDOWN  (Table 2 for Job Changes) (Statistics Canada Website Weekly Wages Canada)  Finance, Insurance, Real Estate, Rental and Leasing Jobs Change: +8,200  Manufacturing Jobs Change: +5,700  Transportation and Warehousing Jobs Change: +600  Wholesale and Retail Jobs Change: +32,400  Educational Services Jobs Change: -2,200  Health Care and Social Assistance Jobs Change: +6,600  Accomodation and Food Services Jobs Change: +3,700  Professional, Scientific and Technical Services  Jobs Change: -14,900  Year over Year Weekly Wage Changes All Workers 15 and Over:  +2.1% Management Occupations:  +0.4% Business Finance and Administration Occupations:  +3.8% Health Occupations:  +2.2% Occupations in education, law and social, community and government services:  +1.5% Occupations in art, culture, recreation and sport: +3.7% Sales and service occupations:  +2.5% Trades, transport and equipment operators and related occupations:  +2.2% Occupations in manufacturing and utilities:  +6.4%  Observations  Statistics Canada reported that the nation’s unemployment fell to 5.7% and that 107,000 jobs were gained after shedding jobs in March. This is the largest one month increase with records going back to 1976. Analysts expected an increase of 12,000 jobs. Weekly annual wage increases were up 2.1%. The increase in wages falls short of the wage growth in mid-2018 and has continued the trend of sluggish growth since the start of the year.

The Numbers

107,000: The economy added 107,000 jobs in April.

5.7%: The unemployment rate fell to 5.7%.

2.1%: Weekly wages increased 2.1% over the last year.

The Good

Employment increased in Ontario, Quebec, Alberta and Prince Edward Island. Several important sectors posted positive job numbers including wholesale and retail trade; construction; information, culture and recreation; public administration; and agriculture. The employment situation improved for some key demographic groups as well. There were job increases for youth aged 15 to 24, people aged 55 and older and women in the core working ages of 25 to 54.

In a hopeful sign for the economy, youth employment accounted for much of the gains in jobs in April, as unemployment for those aged 15 to 24 hit its lowest rate in 43 years. The Labour Force Survey reported that youth unemployment rate fell to 10.3% with jobs for Canada’s younger workers growing by 89,000 over the past year. The rate has not been that low since Statistics Canada starting using its current statistical criteria in 1976.

While the annual wage growth numbers are still not strong compared to other advanced economies, there are some signs of progress. While annual weekly wages decreased from last month, annual hourly wage gains increased to 2.5% in April, the fastest annual gain since September and up from 2.4% in March. Pay increases for permanent employees jumped to 2.6%, the largest increase since August.

The jobs report was welcomed by some analysts as a sign that employers are demonstrating confidence in the Canadian economy:

“’Nearly every indicator of quality came in strong this month: The best-ever gain came with solid full-time job growth, all in employees — rather than self-employed — more Canadians were drawn into labour markets and wages were up,’ said Brian DePratto, senior economist for TD Economics, in a written statement about the results.

‘Chalk this one up as a solid message that employers still have faith in the Canadian economy.’”

The Bad

While the report contained good news for much of Canada’s workforce, not every sector, province or demographic group fared well. Employment decreased in professional, scientific and technical services and in New Brunswick. The employment gains for the remaining provinces were negligible compared to Ontario, Quebec, Alberta and Prince Edward Island.

Contrasting with the vote of confidence that some have interpreted from the April report, some leading economists have recently expressed modest expectations for Canada’s economic growth this year:

Deloitte’s latest economic advisory report projects a year of slower economic growth, a weak Canadian dollar, and a vulnerable economy. Though the dreaded “R-word” (recession) remains a possibility, the consultancy projects modest growth of 1.3% in 2019 and 1.5% in 2020 for Canada.

After posting strong growth of 3% in 2017, the Canadian economy slowed to 1.8% in 2018, and has little momentum heading into this year. Factors such as a drop in residential investment, weaker consumer spending, and a decelerating US economy are projected to moderate growth to 1.3% in 2019, according to Deloitte Canada.

Though the firm says a recession isn’t the most likely outcome, slowed economic growth does make Canada more vulnerable to risks like protectionism, Brexit, and low global interest rates.”

The Unknown

The validity of the data in the April report and the conclusions drawn by many economists was questioned on the day the report was released in Bloomberg:

“A loss of 7,200 jobs in March, and then a gain of 106,500 jobs in April. For David Rosenberg, Canada’s latest employment data just doesn’t add up.

Statistics Canada said Friday that Canadian employment increased by 106,500 positions in April, the biggest one-month increase in data going back to 1976. The country’s jobless rate fell to 5.7%, compared to 5.85 in March.

But Rosenberg, chief economist and strategist at Gluskin Sheff + Associates, says the country’s latest jobs numbers are hard to believe, given what’s happening in the Canadian economy.

‘Did you really believe that the Canadian labour market is so volatile that we could have a [7,200] decline in the labour force in one month, followed by a 100,000-increase in the next month? Is our labour market more volatile than the stock market is? It’s hard to believe,’ Rosenberg said in an interview with BNN Bloomberg Friday.

‘Somehow we’re creating record jobs and in the same survey in the United States, they’re losing jobs in a significant way. So what I’m trying to say is, calm down a little bit. There’s no way that the Canadian economy is nearly as strong as this number would lead you to suggest.’

Rosenberg took issue with a few details in StatsCan’s labour force survey, pointing to how most of the job gains were concentrated among youth, and in sectors such as construction and retail.

‘I thought we were battling a housing bubble in this country,’ Rosenberg said. ‘Meanwhile, we know that consumers are going on the debt treadmill and doing more to repair their balance sheets than head out to the shopping malls.’

Rosenberg, who has been known for his bearish views on Bay Street, questioned any cheering of the April labour figures.

‘It’s like you’re a teacher in high school and your dumbest student just handed in an ‘A’ report and you just don’t really know what to do with it,’ Rosenberg said. ‘I don’t give it an ‘A’ by the way.’”

PeopleScout U.S. Jobs Report Analysis — April 2019

The Labor Department released its April jobs report which shows that U.S. employers added 263,000 jobs in March, beating analyst expectations. The unemployment rate fell to 3.6 percent last month. Year-over-year wage growth remained at 3.2 percent, which is well ahead of the rate of inflation. U.S. employers have added to payrolls for 103 straight months, extending the longest continuous jobs expansion on record.

U.S. Jobs Report – April 2019

The Numbers

263,000: The economy added 263,000 jobs in April.

3.6%: The unemployment rate fell to 3.8%.

3.2%: Wages increased at a rate of 3.2% growth over the last year.

The Good

The U.S. economy demonstrated its resilience with the strong April Jobs report. After shedding jobs in March, manufacturing had a modest rebound adding 4,000 positions while other key economic sectors had impressive gains. Leisure and hospitality added 34,000 positions, education and health services increased by 62,000 jobs and business and professional services jobs grew by 76,000.

The jobs report was generally greeted with enthusiasm by analysts who tempered their responses with caveats about the meaning of the data as in this reporting by Bloomberg.

“It’s clearly telling you this economy is still chugging along very nicely,” Torsten Slok, chief economist at Deutsche Bank Securities, said on Bloomberg Television. “It is inflationary in the sense that wages did go up but they didn’t go up as much as we had expected. Goldilocks is the best description of this,” Slok said.

The surprising overall robustness – which didn’t reflect any surge in temporary hires for the 2020 Census, as some analysts had flagged – follows months of broad labor market strength. While the expansion is poised to become the nation’s longest on record at midyear, economists expect a deceleration this year even after a strong first quarter.

The New York Times noted that the elements of the strong job market have defied conventional economic expectations and could assuage fears of an economic downturn.

“Not that long ago, the overwhelming consensus among economists would have been that you couldn’t have a 3.6% unemployment rate without also seeing the rate of job creation slowing (where are new workers going to come from with so few out of work, after all?) and having an inflation surge (a worker shortage should mean employers bidding up wages, right?).

And yet that is what has happened, with the April employment numbers putting an exclamation point on the trend. The jobless rate receded to its lowest level in five decades. Employers also added 263,000 jobs; the job creation estimates of previous months were revised up; and average hourly earnings continued to rise at a steady rate — up 3.2 percent over the last year…

In particular, it now appears that recession fears that emerged at the end of 2018 were misguided — especially once the Fed backed off its campaign of rate increases at the start of 2019.”

The Bad

The participation rate, those who are working or want to work, decreased in April. The broadest measure of unemployment, which includes part-time workers who want to work full-time has remained virtually unchanged since February. Despite a strong job market and rising wages, some Americans are opting out of the workforce and those who want to more fully participate have not been able to do so.

The April report also showed that the robust job market has not impacted two categories of potential talent over the last year. In April, 1.4 million persons were marginally attached to the labor force, little different from a year earlier. These individuals were not in the labor force, wanted and were available for work, and had looked for a job sometime in the prior 12 months. They were not counted as unemployed because they had not searched for work in the 4 weeks preceding the survey.

Among the marginally attached, there were 454,000 discouraged workers in April, basically unchanged from a year earlier. Discouraged workers are those not currently looking for work because they believe no jobs are available for them.

The Unknown

Jobs in the retail sector decreased by 12,000 in April and by over 49,000 in the last year. The extensive closing of retail locations has come to be known as the “retail apocalypse.” The number of store closings so far in 2019 is already larger than in all of 2018 as Business Insider reports:

“The retail apocalypse is raging on with almost 6,000 store closings announced so far in 2019 — more than the entirety of last year. According to a new report from Coresight Research, U.S. retailers have announced 5,994 store closings this year, compared with 5,864 store closings in all of 2018…Coresight Research CEO Deborah Weinswig predicted that this trend would continue. “The flood of store closures will likely continue for quite some time,” she said. An April UBS report predicted that 75,000 stores would close across North America from this year to 2026. It said e-commerce would make up a quarter of total retail sales by then.”

Retail workers affected by store closings can bring employers important transferrable skills such as customer service and inventory tracking. It remains to be seen how many of these workers will stay in the broad retail sector, including e-commerce, or be attracted into other sectors which can leverage their skills and experience.

PeopleScout New Zealand Jobs Report Analysis — March Quarter 2019

Stats NZ released the March Quarter Labour Market Report which reported that the unemployment fell to 4.2% in the first three months of the year, from 4.3% in the final quarter of 2018. Economists expected a jobless rate of 4.3%. The number of people unemployed declined at a faster rate than the number of people in the labour force. The result was the unemployment rate falling close to its 10-year low of 4.0%, set in mid-2018. The labour market underutilisation rate was 11.3% in the first quarter, the lowest rate since the December 2008 quarter.

OVERALL  Quarter Covering January-March 2019  Employment Change:  -0.2% (Down arrow) Overall Unemployment Rate: 4.2% (Down arrow) Participation Rate:  70.2% (Down arrow) Overall Weekly Wage Change: + 2.0% (Up arrow)  INDUSTRY BREAKDOWN   (Statistics NZ Website Table 9)  Manufacturing Jobs Change: +600  Construction Jobs Change: -1,000  Wholesale Trade Jobs Change: -400  Retail Trade, Accommodation and Food Services Jobs Change: -3,000  Transport, Postal and Warehousing Jobs Change: -3,500  Information, Media and Telecommunications Jobs Change: -200  Financial and Insurance Services Jobs Change: +5,900  Rental, Hiring and Real Estate Services Jobs Change: +4,200  Professional, scientific, technical, administrative, and support services Jobs Changes:  +20,600  Public Administration and Safety Jobs Changes: +400  Education and Training Jobs Changes: -5,200  Health Care and Social Services Jobs Changes:  +0   Observations  Stats NZ released the March Quarter Labour Market Report which reported that the unemployment fell to 4.2% in the first three months of the year, from 4.3% in the final quarter of 2018. Economists expected a jobless rate of 4.3%. The number of people unemployed declined at a faster rate than the number of people in the labour force. The result was the unemployment rate falling close to its 10-year low of 4.0%, set in mid-2018. The labour market underutilisation rate was 11.3% in the first quarter, the lowest rate since the December 2008 quarter.

The Numbers

-4,000:  The economy lost 4,000 jobs in the first quarter of 2019.

4.2%: The unemployment rate fell to 4.2%.

2.0%: Overall wages increased  2.0% over the last year.

The Good

Stats NZ released the March Quarter Labour Market Report which reported that the unemployment fell to 4.2% in the first three months of the year, from 4.3% in the final quarter of 2018 and beating analyst expectations. The number of unemployed declined at a faster rate than the number of people in the labour force. As a result, the unemployment rate fell close to its 10-year low of 4.0% set last year. Compared to last year, 38,200 more people were employed, an increase of 1.5% – comprised of 25,400 women and 12,800 men.

The labour market underutilisation rate was 11.3% in the first quarter, the lowest rate since the fourth quarter of 2008. Underutilisation provides a broad gauge of untapped capacity in New Zealand’s labour market. In the first quarter, the number of people underutilised decreased by 14,000 to 324,000. There were 8,000 fewer underutilised women and 6,000 fewer underutilised men.

The Bad

For the first time in more than four years, the New Zealand economy lost jobs. In addition, the number of jobs created over the past year was slightly more than half the rate of the previous year.  Coupled together, these figures indicate a weakening and possible end of the steady job market growth seen in recent years. The slowing job market may have implications for the economy as a whole as Stats NZ Senior Manager Jason Attewell noted:

“Generally, employment growth tends to lag broader economic growth by about three months, New Zealand has seen a softening of economic growth as measured by gross domestic product over the last six months, and we now are seeing that softening come through the employment rate.”

Wage growth is also frustratingly low, even in a tight labour market, as the New Zealand Herald reports:

“ANZ economists have picked unemployment to remain flat at 4.3% although they acknowledge risks in either direction depending on the flow through from business confidence.

Regardless, it looks set to remain at levels which economists often describe technically as ‘full employment.’

That has led to some debate as to why wage growth has remained so subdued. In fact, it has been a major source of economic uncertainty globally as well as locally.

‘More significant government-related increases are likely to come later in the year,’ Westpac’s Gordon says.

‘Wage growth tends to lag the broader economic cycle. Even if the demand for new workers is fading, there appears to be enough accumulated pressure in the labour market to support a pickup in wage growth over the next couple of years.’

ASB’s Mark Smith described this year as a pivotal one for wage trends.

‘Our view had been that stretched labour market capacity and the boost to wages provided by minimum wage increases and moves towards more Fair Pay agreements would be sufficient to trigger a generalised firming in overall wages,’ he wrote.

‘The failure to date for wages to come to the party has challenged that view.’”

The Unknown

What will the impact of new technology be on New Zealand’s future workforce? The New Zealand government asked the Productivity Commission to conduct an inquiry into technological change and the future of work. The result is an issues paper that presents four possible scenarios as presented in CIO Magazine:

  1. More Tech More Jobs: Technology adoption accelerates in this scenario, and the technologies adopted create more jobs than they replace. Both capital and labour productivity rise in this scenario, perhaps substantially.
  2. More Tech and Fewer Jobs: This scenario, in common with the first one, is driven by accelerating technology adoption. However, it differs in that the technology adopted is, overall, labour replacing. Capital productivity rises substantially in this scenario, as firms increasingly adopt productivity-enhancing technologies. Labour productivity might also rise, as lower-skilled roles are increasingly automated. An expected consequence of this combination of drivers is widespread unemployment.
  3. Stagnation: In this scenario, the pace of technological adoption slows. This could be due to declining innovation, as technological bottlenecks prove harder to overcome than expected. Alternatively, slower change could occur as technology adoption by firms slows – perhaps because newer technologies are less productivity enhancing for firms than those of the past.
  4. Steady As: In this scenario, the technological drivers of labour market change over the next one-to-two decades stay within the bounds of New Zealand experience over the past one-to-two decades. This future offers ongoing change, according to the paper, but the rate of that change is roughly that which New Zealanders are familiar with.

Regardless of how or whether these scenarios take place in New Zealand’s economic future, New Zealanders appear to be unconcerned about losing their jobs to technology. The New Zealand Herald reports that a  recent Massey University study found 87.5% of respondents either disagreed or strongly disagreed with the statement “smart technology, artificial intelligence, robotics or algorithms could take my job.”

PeopleScout Australia Jobs Report Analysis – March 2019

The 25,700 jobs added in March were in line with analyst expectations. The increase was made up entirely by full-time positions, which surged up 48,300. That was offset by a decrease of 22,600 part-time jobs. The unemployment rate fell to 5%, a slight increase from February’s eight-year low of 4.9%, but it is due in an increase in Australians participating in the workforce.

AU Jobs Report – March 2019

The Numbers

25,700: The Australian economy added 25,700 jobs in March.

5.0%: The Australian unemployment rate rose to 5.0%.

65.7%: Labour force participation rose to 65.7%.

+7: The Business Confidence Index increased to +7 in the latest NAB release.

Upside

Despite the increase in the unemployment rate, the March numbers are good news for the Australian economy. According to Reuters, analysts expected an increase in employment of just 12,000. The economy added more than double that number. The largest increases were in Queensland with 10,400 jobs and Victoria with 10,000.

Full-time employment rose by 48,300 in March, which was offset by a decrease of 22,600 in part-time jobs. Experts say these numbers point to a “fundamentally healthy” Australian economy.

Additionally, the reason for the increase in the unemployment rate is because more Australians entered the job market in March, bringing the labor participation rate up to 65.7%.

Downside

While the overall numbers are positive, experts say they notice some concerning trends. The under-employment rate, which measures the proportion of the workforce that have a job but would like to work more hours, increased to 8.2%, and labour market underutilisation, which is the broadest measure of labour market slack including both unemployed and underemployed workers, also increased to 13.2%.

Experts say that these figures suggest Australia will continue to experience sluggish wage growth. They also expect unemployment to increase further by the end of 2019.

Unknown

The new numbers raise questions about when the Reserve Bank of Australia will cut rates. The West Australian reports:

“Some private economists now believe the RBA will have to cut rates three times over the next 18 months – by 0.75 points – because nationwide inflation is tracking near a three-year low, wages are hardly rising, and key employment markets are struggling. That would put the official interest rate at 0.75% – historically unprecedented territory.”

The West Australian

Global Economic Snapshot – Q1 2019

The strong job growth and tight labor markets which characterized most of the world’s leading economies in 2018 continued in the first quarter of 2019. And while the overall economic headlines have been positive, employers have been challenged by record high job openings, rising wages and uncertainty over trade. For many economies, 2019 got off to a strong start, but the outlook for the remainder of the year is uncertain.

Low Unemployment: The Diminishing Available Talent Pool and a Tight Labor Market

The United States ended the first quarter with an unemployment rate of just 3.8%. While the partial government shutdown may have impacted the negligible job growth in February, the economy still added an average of 180,000 jobs per month in the first quarter. This is robust job growth by any measure, but it is smaller than the 223,000 jobs created per month in 2018. These numbers suggest that job growth is still strong but the pace of job creation is slowing.

U.S. employers posted nearly 7.6 million open jobs at the start of the year, a near record high and a sign that businesses are continuing to compete for a diminishing pool of available talent. In March, it was estimated that there were about 1 million more open jobs than unemployed workers.

In contrast to its North American neighbor, Canada’s employment situation was mixed. The first quarter ended with an unemployment rate of 5.8%, but after two strong months of job gains, Canada lost jobs in March.

In Europe, many leading economies posted strong job gains and low unemployment. In the UK, the March Labour Market Report showed that a greater percentage of people in the UK were working than at any time since comparable records were kept. As a result, the unemployment rate in the UK plunged to 3.9%, the lowest rate since 1975. For other major European economies, the unemployment situation was mixed. The Eurozone’s unemployment rate was 7.8%, slightly lower than at the end of 2018. France posted an unemployment rate of 8.8% during the quarter while Germany recorded its unemployment at a very low rate of 3.3%.

In the Asia-Pacific region, unemployment continued to be negligible in the leading Asian economies. During the first quarter, China reported an unemployment rate of 3.8%, Japan was at 2.3%, Hong Kong at 2.8% and South Korea at 4.7%. India’s unemployment rate of 6.7% was slightly higher than a year earlier.

Other APAC economies posted strong employment numbers. Australian unemployment fell to 4.9%, the lowest level in eight years, and New Zealand reported that the unemployment rate had risen to 4.3% in the final quarter of last year.

Low unemployment has led employers to compete for a diminishing pool of available talent and has made it even more necessary to retain workers who may be lured by competitors offering higher wages and other incentives.

Wages Rising but Inflation Remains Low

The conventional wisdom holds that wages rise when the supply of workers is low. Yet, wage increases have grown very gradually even in economies with very low unemployment. One of the reasons for this is that inflation rates in many advanced economies are quite low, so even modest wage increases can have a positive impact on a household’s ability to spend and save. In some economies, wages began to rise significantly in 2018 and continued in 2019. In the U.S., annual wage increases rose to 3.4% in February before contracting slightly to 3.2% in March. Coupled with an inflation rate of just 1.5%, wage increases in the U.S. are growing more than two times as much as the price of goods and services. In the UK, the annual wage increase of 3.4% was still well above the inflation rate of 1.9%

In two other major economies, the wage growth picture is not as positive. Canada was posting year-over-year wage growth of more than 3% in mid-2018, but by March 2019 the average year-over-year wage growth for permanent employees was just 2.3%. While Canada’s inflation rate was 1.5%, the same as the U.S., Canadian workers benefited less than their U.S. counterparts from their wage increases.

In Australia, wage growth was just 2.3% in 2018 and some estimate that Australians are experiencing their lowest increase in pay since World War II. With inflation running at 1.8%, workers are still coming out ahead, but not as much as in the U.S. or UK. The reasons for the difference in wage growth among these four Anglosphere economies are rooted in the structures of the individual economies. Slow wage growth has contributed to low inflation in each country, but as wages rise, so does the possibility of an increase in inflation. If inflation increases, there would be even greater incentive for workers to change jobs to increase their income and for employers to respond by offering higher wages.

High Anxiety – Trade and Jobs

In North America, NAFTA, the agreement which has tied the economies of Canada, the United States and Mexico, was set to be replaced by the new USMCA treaty. The treaty was signed by the heads of all three countries late last year but it has not yet been ratified by any of their respective legislatures. The uncertainty due to the lack of clear tariff regimes in the near future may cause considerable disruption in different sectors in each economy. In the U.S., manufacturing, a sector which may be most impacted by North American trade, lost jobs in March for the first time since 2017.

But any concerns in North America pale in comparison to anxiety over Brexit. As of the time of publication, the UK is set to leave the European Union on October 31, 2019. There remains a possibility that the UK will exit the EU without any agreement and possibly experience economic chaos.

If and when Brexit occurs, it has already had an impact on the UK workforce, especially in the area of foreign workers. The Guardian reports:

“There were an estimated 2.33 million workers from the EU27 in the UK between October to December in 2017, but that figure dropped to 2.27 million a year later. A notable drop in workers from A8 countries, which joined the bloc in 2004 and include Poland and the Czech Republic, largely accounted for the decrease. It contrasted with an increase in the number of non-EU workers in the UK, rising from 1.16 million to 1.29 million in the same period. This was an increase of 130,000 compared with the equivalent period 12 months earlier, and the highest number since records began in 1997.”

The Guardian

Given the importance of workers from the EU in sectors such as healthcare, hospitality and meatpacking, a continued exodus of workers from the EU will have a major impact on key UK industries.

With so much concern over the economic future, why have the job numbers in the UK been so positive? While it may simply be a matter of filling the demand employers have for talent, Bloomberg suggests a more somber reason:

“One explanation for the resilience of the labor market is that firms are hiring workers rather than spending on capital equipment because employment decisions are easier to reverse in a downturn.”

Bloomberg

In other words, newly hired workers are more expendable in an economic downturn than capital equipment, a sobering thought for both employers and workers during these uncertain times.

PeopleScout UK Jobs Report Analysis – April 2019

The April Labour Market Report released by the Office for National Statistics posted record-breaking numbers for the nation’s labour market. In the three months covering December 2018 through February 2019, the highest level of people were working in the UK since comparable records have been kept. Nominal wages rose by 3.4%, the same as last month. This wage level reported in the last two months is the highest year-over-year level in over a decade.

UK Jobs Report – April 2019

The Numbers

  • The number of people working in the UK rose by 179,000 to 32.72 million. This is the highest figure since records began in 1971.
  • The unemployment rate held at 3.9%, excluding last month’s report, this is the lowest rate since 1975.
  • The UK economic inactivity rate was estimated at 20.7%, with 213,000 fewer inactive individuals than a year earlier.
  • Compared to a year earlier, 457,000 more people were working in the UK.
  • The employment level for men was estimated at 80.5%; it has not been higher since December 1990 to February 1991. For women, the employment level was estimated at 71.8%, the highest level on record. (The increase in the employment rate for women in recent years is due partly to changes to the state pension age for women, resulting in fewer women retiring between the ages of 60 and 65 years.)

After a Brexit Extension is Granted There is Good News for the Labour Market

The European Union extended the date for the UK’s formal exit (Brexit) to October 31, 2019. This labour market report covers a period when Brexit was expected to take place at the end of March. While there is no more clarity about what Brexit will look like, if it happens at all, the good news about the labour market was greeted with less anxiety than in previous months when Brexit appeared to be nearly imminent.

Much of the good news was due to a decrease of workers from the EU and the increase in women in the nation’s workforce as the Financial Times reports:

“Britain’s jobs market has been robust despite wider concerns about the future of the economy after Brexit. With unemployment at the lowest rate since 1974 and fewer workers coming from the EU, UK businesses have sought new sources of labour. ‘The growth in employment was driven mainly by the number of women getting into jobs,’ the Office for National Statistics said. Its latest labour market data showed women accounted for 80% of the 179,000 increase in employment during the three months…”

The Financial Times notes that patterns of recruitment are changing for some employers reflecting the increased level of women in the workforce and a post-Brexit environment:

“Last month, budget hotel chain Travelodge said it was targeting working mothers with new shift patterns to manage Brexit-related staffing shortages. Amber Rudd, work and pensions secretary, said it was ‘particularly pleasing to see there are now a record number of women in work and a record number of people with secure, full-time jobs.’”

Record Job Openings are a Challenge for Employers

The high number of job openings is a fundamental component in the difficult environment that UK employers find themselves. Commenting on the April Labour Market report, Suren Thiru, Head of Economics at the British Chambers of Commerce (BCC), commented:

“The strong increase in employment, coupled with another fall in the number of people out of work, suggests that the UK labour market remains in good order.However, behind the strong headline figures, a number of key challenges remain. Businesses are increasingly reporting that persistent hiring difficulties, cost pressures and ongoing uncertainty are dampening recruitment intentions. If this trend is sustained it could well translate into a weakening in UK jobs growth over the next year. Pay growth continues to comfortably outstrip price growth, and in real terms is likely to remain in positive territory for some time to come. However, the combination of a sluggish economy, weak productivity and high upfront costs for business is likely to limit the extent of pay rises. The record high number of job vacancies is further confirmation of the perennial skills shortages plaguing UK businesses, which continues to hold back business activity and growth. To protect the long-term health of the UK labour market, businesses need answers to key questions on how firms will be able to manage their future workforce needs over the next few years. Brexit has distracted government and Westminster for too long, much more must be done at home to address the UK’s chronic skills shortage, including easing the burden of upfront business costs to help firms to hire and train staff.”

More than at any time in recent economic history, it is clear that those enterprises that have a strong employer brand as well as a solid recruitment and retention program will be the clear winners in this difficult market.

Temporary Workers – An Overlooked Source of Talent?

Of the 1.54 million temporary employees during the period ended February 2019, more than a quarter were temporary because they could not find a permanent job. These workers could be in positions where they have the skills to do their jobs but have been unable to find full-time work. Of course, geographic and other factors may play a part in their inability to find full-time work, but with so many permanent job openings available, there appears to be a disconnect between employers and this large pool of talent. As the Guardian notes:

“..Nor is there much evidence of a big switch to the hiring of temporary workers in the three months to February – a period when Brexit uncertainty was ratcheting up. The 179,000 increase in employment was split 138,000 full-time and 41,000 part-time. Self-employment was down by 23,000.”

The Guardian

Employers that can successfully recruit from this large pool of temporary workers could have an important advantage in filling their open positions and have a competitive edge in attracting increasingly scarce available talent.

PeopleScout Canada Jobs Report Analysis — March 2019

Statistics Canada reported that the nation’s unemployment remained at 5.8% and that the nation lost 7,200 jobs in March after two months of healthy job gains. Market expectations were for an increase of 10,000 jobs. The March employment report showed the number of full-time positions contracted by approximately 6,400, whereas part-time jobs were roughly unchanged, with a net decline of approximately 900. Weekly annual wage increases were up 2.2% and hourly wages increased by 2.4%. The increase in wages still falls short of the wage growth in mid-2018.

Canada Jobs Report – March 2019

The Numbers

7,200: The economy lost 7,200 jobs in March.

5.8%: The unemployment rate remained at 5.8%.

2.2%: Weekly wages increased 2.2% over the last year.

The Good

While the March Labour Market report released by Statistics Canada showed net job losses in March, the first quarter of 2019 saw 116,000 jobs added to the economy. On a year-over-year basis, employment grew by 332,000 (+1.8%), with gains in both full- (+204,000) and part-time (+128,000) work. Over the same period, total hours worked rose by 0.9%.

Despite the results in March falling below analyst expectations, the news was not received with particular concern:

“We got a little dip in employment, but the numbers are volatile and it’s been on a pretty strong run over the prior half year,” said Nathan Janzen, senior economist at Royal Bank of Canada.

Analysts said the small decline in March, following six months of consecutive gains, was unlikely to alter the Bank of Canada’s view of employment as a bright spot in Canada’s economy.

“After such a strong run of employment gains, a modest pull-back in March is of little concern to us and won’t raise many eyebrows at the Bank of Canada either,” said Andrew Grantham, Senior Economist at CIBC Capital Markets, in a note.”

The March reports also showed that more Canadians were working in the finance, insurance, real estate, rental and leasing industry and in public administration.

The labour market continued to improve in terms of wage increases. Annual hourly wage gains accelerated to 2.4% in March, the fastest annual gain since September, up from 2.3% in February. Pay gains for permanent employees rose to 2.3%, the strongest increase since August.

The Bad

Although the losses were modest, the March report was the first to report a decrease in jobs in seven months. Employment declined in health care and social assistance; in business, building and other support services; and in accommodation and food services. Canada’s two most populous provinces, Ontario and Quebec, lost jobs March.

While wage growth continues to pick steam, the rate of increase is smaller than in mid-2018. Concern over low wage growth was reflected in a recent poll conducted on behalf of  Indeed Canada which showed that  more than half of those surveyed plan to ask for a raise in 2019:

“Conducted by Censuswide on behalf of job site Indeed Canada, the research found that only 13% of Canadian workers surveyed are comfortable with their current rate of pay. That’s down from 17% from when Indeed commissioned the same survey one year ago.

The decline in salary satisfaction will prompt 53% of respondents to ask for more pay this year, the survey found.”

Widespread dissatisfaction over wages is a concern for Canadian employers because of pressure to raise salaries for their current workforce which may be prompted to look elsewhere to increase their incomes.

The Unknown

The US-Mexico-Canada (USMCA) trade agreement which was signed by the heads of state of the three respective countries has yet to be ratified by any of their legislatures. The agreement, which was created to replace NAFTA, could have a significant effect on important sectors in the Canadian economy.  However, it is unclear what a final version of the USMCA would look like and whether it will be implemented at all. The Canadian Foreign Minister warned that changes to the original agreement could lead to chaos:

“Canadian Foreign Minister Chrystia Freeland on Thursday cautioned against the idea of reopening a new continental trade pact with the United States and Mexico, saying it could be a ‘Pandora’s box.’

U.S. House Speaker Nancy Pelosi told Politico this week that changes needed to be made to the text of the United States-Mexico-Canada (USMCA) trade deal to ensure its labor provisions could be enforced.

‘When it comes to the issue of actually opening up the agreement, that’s where Canada’s view is, we’ve done our deal,’ Freeland told reporters on the sidelines of a NATO meeting in Washington when asked about Pelosi’s comments.

‘This was a very intense negotiation. A lot of time, a lot of effort went into it, compromises were made on all sides, and we believe that people need to be very careful around opening up what could really be a Pandora’s box,’ she added…

‘Canada has done its share, we have done our work, and now it’s up to each country to work on ratification,” said Freeland.

She reiterated that Canada could find it hard to press ahead with efforts to ratify the treaty as long as U.S. maintained tariffs on imports of Canadians steel and aluminum.”

PeopleScout U.S. Jobs Report Analysis — March 2019

The Labor Department released its March jobs report which shows that U.S. employers added 196,000 jobs in March, higher than analyst expectations. The unemployment rate remained steady at  3.8% last month. Year-over-year wage growth decreased to 3.2%, which is more than twice the rate of inflation which was 1.5% in February. U.S. employers have added to payrolls for 102 straight months, extending the longest continuous jobs expansion on record.

U.S. Jobs Report – March 2019

The Numbers

196,000: The economy added 196,000 jobs in March.

3.8%: The unemployment remained at 3.8%.

3.2%: Wages increases fell to a rate of 3.2% growth over the last year.

The Good

Due to the weak February job report numbers, the March report was highly anticipated and the strong numbers came as a relief to those who feared an economic slowdown. Not only were the 196,000 jobs added well above expectations, the February job increases were revised from 20,000 up to 33,000. The New York Times noted:

“Everyone can relax a little.

The solid job gains that have come to define the current economic expansion resumed in March. The gain in hiring, though widely forecast, will help clear some of the doubts hanging over the economy. Though the economy is expected to slow this year from the strong pace of 2018, Friday’s report was a welcome sign.”

The healthcare sector was among the job creation leaders in March adding 49,000 jobs last month and 398,000 over the past 12 months. Employment in professional and technical services grew by 34,000 in March and 311,000 over the last year. Payrolls also increased last month in transportation and warehousing, leisure and hospitality, and the financial sector.

While the unemployment rate remained unchanged, the broadest measure of underemployment, which also includes part-time workers who would like full-time work, has dropped to a level not seen since the early 2000s.

In addition to strong job growth, the number of people seeking U.S. unemployment benefits fell to its lowest level since late 1969. This is a sign that employers are retaining their workers despite fears by some of a slowing economy.

The Bad

Annual wage growth fell to 3.2% after hitting a near decade high in February. The decline in wage growth is coupled with a decrease in those participating in the labor force and extremely high job vacancies. As Reuters reports:

“There are about 7.58 million open jobs in the economy. Vacancies could remain elevated as 224,000 people dropped out of the labor force last month. The labor force participation rate, or the proportion of working-age Americans who have a job or are looking for one, fell to 63.0% in March from 63.2% in February, which was the highest in more than five years.”

The large number of open jobs is not consistently attracting more Americans to join the workforce which puts considerable pressure on employers to compete for talent.

Despite overall job gains for the economy, manufacturing shed jobs for the first time since mid-2017. Until last month, manufacturers had enjoyed their longest job creation streak since the 1990s. The retail sector shed 11,700 jobs last month, continuing a trend of decreased employment in this sector.

The number of those working in temporary help services also declined last month. This drop in the temporary help sector may have broader implications for the labor market in coming months. The Washington Post noted:

“The level of temporary workers, while still high, has stalled this year, another sign the economy might be cooling as widely expected, noted said Erica Groshen, a visiting scholar at Cornell University and former head of the Bureau of Labor Statistics, the nonpartisan agency that tabulates the jobs data.

‘The labor market is very strong…the only slightly yellow warning sign is temporary help,’ she said. ‘It’s a leading indicator that can be a harbinger that companies are slowing down hiring or take a pause.’

Businesses typically hire temporary workers when they want to expand their workforce quickly, but those workers are also often the first to go when firms try to cut costs.”

The Unknown

While the United States is enjoying a record run of job growth, there are indicators that some Americans are not optimistic that this trend will continue. A recent Conference Board survey elicited responses that mirror those given before the last recession. The Daily Herald reports:

“The survey, a widely followed gauge of consumer confidence produced by the Conference Board, a business research group, goes beyond asking respondents about the state of the economy. It also asks whether they think jobs in their area are ‘plentiful’ or ‘hard to get.’

The collective responses to those questions can foreshadow how job growth and the unemployment rate will move over time. When more people say jobs are plentiful and fewer say they’re hard to get, hiring typically rises and the unemployment rate falls. Wages are also more likely to increase.

‘It’s a good predictor of how the labor market evolves,’ said Joe Song, senior U.S. economist at Bank of America Merrill Lynch.

In July 2007, the percentage of Americans who said jobs were plentiful exceeded those who said they were hard to get by 11 points, indicating a good job market. The unemployment rate was a low 4.7% that month.

But the gap between the proportion of respondents saying jobs were plentiful and those saying they were hard to get then fell steadily – until it was barely positive in December that year, when the recession officially began. The unemployment rate remained at 4.7% or lower for four months before jumping to 5% in December and kept rising as the recession worsened.

The Conference Board’s measure plunged into negative territory in 2008 and 2009 as far more Americans said jobs were hard to get than plentiful. It bottomed at minus 46.1 in November 2009, one month after unemployment peaked at 10%, the highest rate in 26 years.

Similar downturns in the Conference Board’s data preceded previous recessions.

‘It is highly correlated with unemployment,’ Gad Levanon, chief economist at the Conference Board, said. ‘They have very similar turning points.’

The measure now indicates a sturdy job market but one that may weaken a bit. In March, far more Americans said they thought jobs were plentiful than hard to get, but the gap between the two narrowed by the most since the recession. The decline could still be a blip rather than evidence of job-market weakening, Levanon cautioned.”