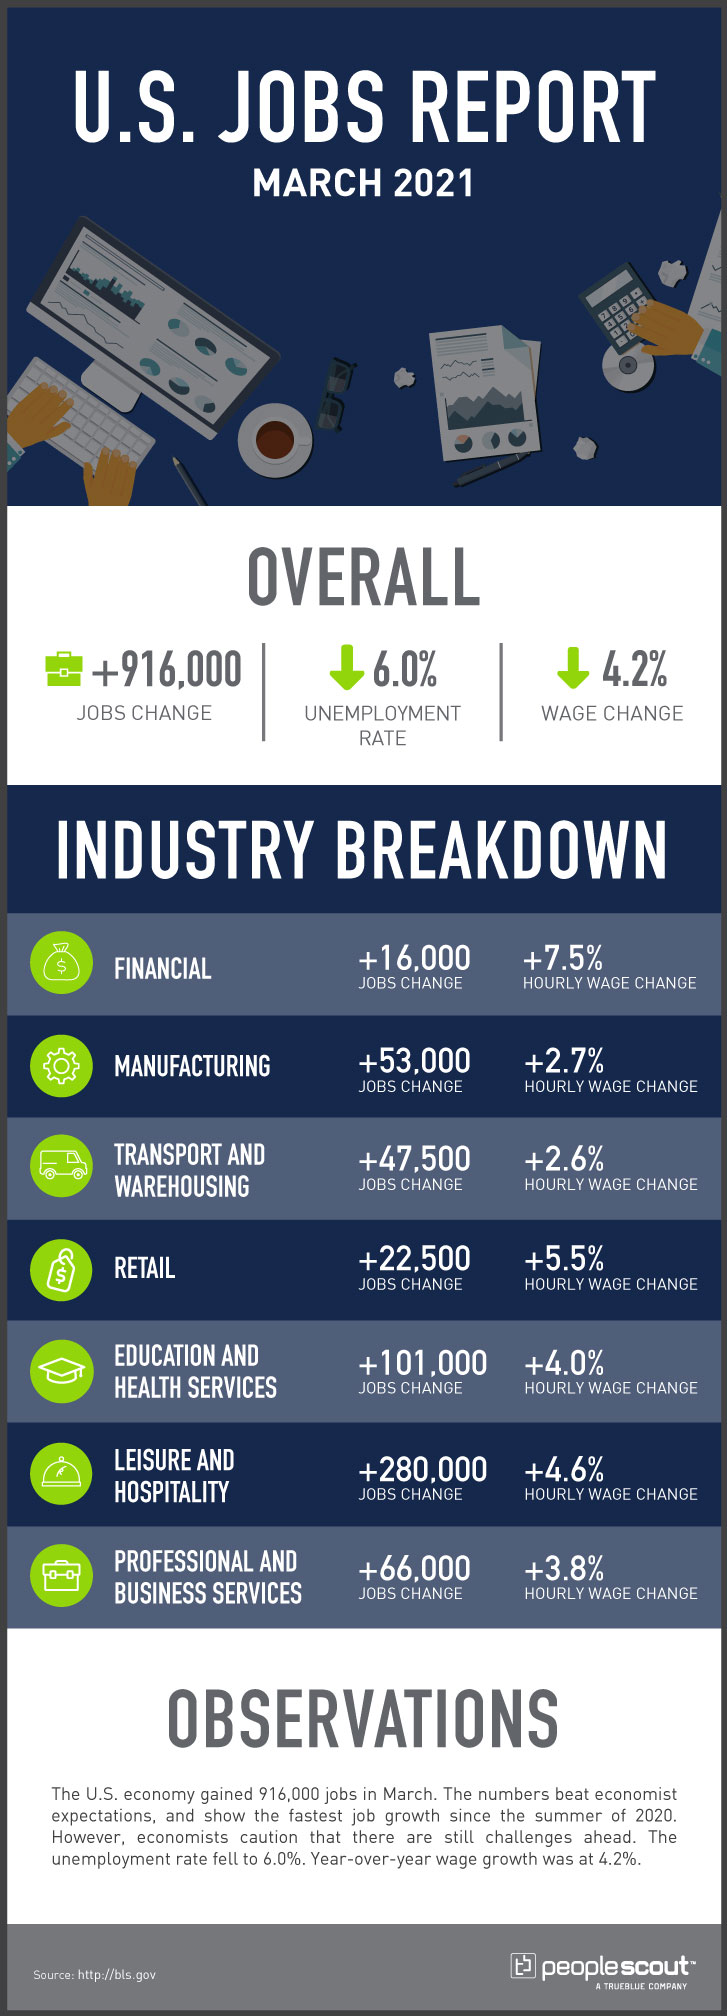
PeopleScout Australia Jobs Report Analysis – August 2019

Australia’s economy added 34,700 jobs in August. The unemployment rate rose to 5.3% as labour participation increased. The Bureau of Statistics reports that full-time employment decreased by close to 15,500 and part-time employment increased by approximately 50,200.

Australia jobs report infographic

Numbers

34,700: The Australian economy added 34,700 jobs in August.

5.3%: The Australian unemployment rate rose to 5.3%.

66.2%: Labour force participation rose to 66.2%.

+1: The Business Confidence Index fell to +1 in the latest NAB release.

Upside

The Australian economy added 34,700 jobs in August, beating analyst expectations of just 15,000. While the unemployment rate increased, this was due in part to the growing number of Australians that are either working or looking for work. The labour force participation rose to 66.2%, a record high.

In seasonally adjusted terms, the largest increases in employment were in Victoria, up 20,300 and New South Wales with an increase of 16,700. Since August 2018, full-time employment has increased by 186,700 persons, and part-time employment has increased by 124,000.

Downside

This year-long trend of full-time job growth outpacing part-time employment did not hold in August. Close to 15,500 full-time jobs were eliminated in August with this decrease offset by an increase of approximately 50,200 part-time positions. This growing participation rate boosted the unemployment number to a 12 month high. Unemployment rates spiked in South Australia, where it rose from 6.9% to 7.3%, and Tasmania, where it increased from 6% to 6.4%.

The underutilisation rate, which includes those who are both unemployed and underemployed (needing additional work) also rose to 13.8%. The number of available workers is growing faster than the number of jobs, especially full-time jobs. Much of the increase in the nation’s labour force is due to strong population growth figures fueled by immigration. The most recent quarterly ABS data shows Australia’s population grew by 389,000, or 1.6% year leading to March 2019, which includes a 250,000 rise in net overseas migration.

This weakness in the job market is bad news for those hoping to see wage increases in the near future as BIS Oxford economist Sean Langcake explained:

“While employment growth has been reasonably healthy over the past year, the demand for labour is being met with increased supply. This is working to keep a lid on wages growth.”

Job Growth in the Service Sector

In the last year, which sectors have driven the “reasonably healthy” growth? A recent article by Jason Murphy notes that Australia is transforming into a service economy. A service economy is one that runs primarily on services provided rather than on goods produced. This can be viewed as a net positive for the nation.

Since March 2013, Australia has added over one million jobs in household and business services while losing jobs in manufacturing and mining. Data from ABS (Australian Bureau of Statistics), shows that while manufacturing jobs once paid as well as work at a bank or telecommunications work, this is no longer the case. Compared to manufacturing, there is much more money to be made in the service sector.

While taking a broad view of what constitutes a service job, Murphy argues that the growing service sector is good for the country, which has an aging population and is faced with global trade uncertainty:

“We have this old-fashioned idea that service jobs are burger-flipping, and yes, there’s entry-level jobs like that, but lots of service sector jobs are doctors and nurses, lawyers and consultants.

Those are good jobs in many ways. Safe, well-paid jobs that you can do until late in life. But they are also good because it is much harder for international trade to undermine them. Chinese manufacturing may have caused the demise of a lot of Australian factories, but Chinese hospitals don’t do much to affect Australian hospitals.”

PeopleScout UK Jobs Report Analysis – September 2019

The September Labour Market Report released by the Office for National Statistics, which includes the three months from May 2019 through July 2019, reported that 31,000 jobs were created as the unemployment rate fell slightly to 3.8%. Nominal wages showed an annual increase of 3.8%.

Uk jobs report infographic

Notable figures from the September report include:

  • The UK employment rate was estimated at 76.1% and is tied for the highest rate on record since records began in 1971.
  • The number of job vacancies fell to 812,000, the lowest level since the end of 2017.
  • The annual wage increase including bonuses jumped to 4.0%. 

Modest Job Gains and Decreased Vacancies Point to Slowing Growth

Jobs continued to grow in the UK over the quarter, but the growth was at a tepid pace.  Since the report covering the same quarter last year, which showed only 3,000 job gains, 369,000 jobs have been added. At the same time, the number of job vacancies is dropping steadily.

John Philpott, the director of the Jobs Economist consultancy, noted that private-sector job creation was at a “near standstill.” Only 2,000 of the 31,000 jobs created over the quarter came from the private sector.

“These latest figures confirm recent signs of softening in the UK labour market. Recruitment appears to have weakened most noticeably in smaller private sector businesses, though it is unclear to what extent this reflects prolonged uncertainty over Brexit or a broader slowdown in the economy,” Philpott said.

While economic growth appears to be slowing in many developed economies, including the UK, there were numbers released in the report which point to Brexit’s impact.  Manufacturing is a sector that is among the most vulnerable to trade uncertainty and disruption. During the same quarter last year, manufacturing in the UK produced 23,000 new jobs and grew at an annual rate of 1.2%. This year, manufacturing shed 5,000 jobs during the quarter with a 0% annual growth rate.

Employers Postpone Hiring But for How Long?

A survey released by KPMG and The Recruitment and Employment Federation showed that the number of workers hired for permanent jobs through recruitment agencies decreased at the fastest pace in more than three years in August.

The survey showed that temporary hiring rose at its slowest pace in 75 months. Permanent placements fell for the sixth month in a row as employers postponed hiring. “Brexit uncertainty continues to take its toll on the jobs market,” James Stewart, vice chair at KPMG, said.

With a resolution to the Brexit crisis nowhere in sight, it is unclear how long employers will continue to be cautious about hiring. The UK economy has already withstood Brexit deadlines and job growth has continued. However, the October 31 deadline comes in the wake of a political crisis and the shutdown of Parliament. It remains to be seen how employers will respond to continued uncertainty or after some level of resolution takes place in the coming weeks.

It is Still a Job Seeker’s Market

With the backdrop of a shuttered Parliament and dire warnings about a recession resulting from a “no-deal Brexit,” the September report still showed a labour market that was growing, albeit slowly, with decades low unemployment and a record-high number of people working. The healthy wage increases are a result of a market with strong demand for talent. Even the level of job vacancies, while lower than in recent years, is by no means negligible.

While many employers appear to be scaling back hiring, they are doing so during a tight labour market. Given the potential for shifting market conditions, having a sound, flexible, recruitment and retention strategy for UK enterprises will be a key factor in their success in the uncertain months ahead.

PeopleScout Canada Jobs Report Analysis – August 2019

Statistics Canada surveyed that the nation’s unemployment remained at 5.7%. In August, 81,000 jobs were created. Weekly annual wage increases were up 3.6%, a full percentage point lower than the previous month. Much of the increase in August was in part-time work.

canada jobs report infographic

The Numbers

+81,000: The Canadian economy added 81,000 jobs in August.

5.7%: The unemployment rate remained steady at 5.7%.

3.6%: Weekly wages increased by 3.6% over the past year.

The Good

The headline number in the August jobs report is good news for the Canadian economy. The 81,000 jobs added quadrupled the 20,000 job increase that analysts expected, according to Bloomberg. The increase is more than five times larger than Reuters economists expected, at just 15,000. Over the past year, Canada has added 471,300 jobs, the highest number since 2003. With this increase, the unemployment rate remained at 5.7%, which is near a historic low.

Ontario saw the biggest increase in jobs with 58,000 new positions, while Quebec, Manitoba, Saskatchewan and New Brunswick also gained jobs. Unemployment stayed steady for most of the country, but British Columbia and Nova Scotia saw an increase in their unemployment rates as more people started looking for work, CBC reports.

The Bad

While the 81,000 number looks great, the majority of the positions created are part-time jobs. The Global News reports that 57,200 of the newly created jobs are part-time Additionally, 42,000 of the positions are held by workers under 24-years-old. However, the majority of the jobs created over the past year have been full-time positions.

The Unknown

For those with questions about whether the Bank of Canada would consider a rate cut, the latest report indicates that is unlikely, Reuters reports.

However, according to The Wall Street Journal, some experts say the looming global downturn could start to have more of an effect on the Canadian economy.

“’We expect the global slowdown to take a more material bite’ by the fourth quarter, CIBC World Markets economist Avery Shenfeld said. He said that could prompt the Bank of Canada to lower interest rates in late December or early next year.”

PeopleScout U.S. Jobs Report Analysis – August 2019

The Labor Department released its August jobs report which shows that U.S. employers added 130,000 jobs, lower than the 165,000 analysts expected. The unemployment rate remained at 3.7% — a near 50 year low. Year-over-year wage growth remained at 3.2%, well ahead of inflation.

us jobs report infographic

The Numbers

130,000: The economy added 130,000 jobs in August

3.7%: The unemployment rate remained steady at 3.7%.

3.2%: Wages increased by 3.2% over the past year.

The Good

According to economists, August’s jobs report numbers are decent but not great. The New York Times reports that one of the highlights of the report is the increase in labor market participation, which grew from 63% to 63.2%. This indicates that the economy is strong enough to draw in people who have been sidelined. The number is even more positive among workers between 25- and 54-years old, the prime working ages. In that group, the percentage of people working or looking for work increased from 82% to 82.6%.

The Bad

While many of the details of the latest report are not necessarily bad, they’re not necessarily good either. The job gains fell short of analyst expectations, and according to the Wall Street Journal, 25,000 of the jobs created in August are temporary positions for the 2020 census. Private-sector employers added just 96,000 jobs. Job growth appears to be slowing.

The New York Times also reports that industries that involve making something – manufacturing, mining and construction – are experiencing the most significant slowdowns, and this could be an indication that the economy is slowing. However, economists say that this report demonstrates that fears of a recession are overblown.

The Unknown

The big question is whether slowing growth is a symptom of a larger problem in the U.S. economy. The New York Times reports that while some sectors of the economy are slowing more than others, industries like business and professional services and healthcare are growing just fine. This suggests that while exceptional job growth isn’t likely to continue forever, the economy is more stable than some have feared.

The Wall Street Journal tells a similar story, with one analyst suggesting that the labor market has peaked, but could stay stead for some time.

“Overall economic growth probably averaged 2% over the last 12 months,” wrote Wall Street Journal Chief Economics Commentator Greg Ip. “Given stable unemployment, that’s probably the U.S. economy’s long-run potential. Something will upset this equilibrium, but it’s hard to say what. For now, fiscal policy, trade war and interest rates seem to be mostly canceling each other out.”

Global Economic Snapshot: September 2019

Labor Markets Shrug-Off Anxiety

The first seven months of 2019 have provided economists with an important lesson: labor markets can continue to expand and strengthen even during times of profound economic uncertainty. The unresolved trade issues that are at the root of this uncertainty include:

  • The unclear future of the U.S.-Mexico-Canada trade agreement, which was negotiated to replace NAFTA. This treaty remains unratified in the legislatures of all three nations.
  • The imposition of tariffs between the U.S. and China, the world’s two largest economies. The escalation in tariffs has been routinely described as a “trade war,” with significant increases scheduled for September.
  • No Brexit agreement has been struck, but there is a deadline looming on October 31.

Yet, despite the threat of future instability, most leading economies continued to have low unemployment, strong job creation (although often at a reduced rate of growth compared to 2018), and high levels of job vacancies. As economic expansion continued well into the third quarter, employers were challenged by the scarcity of available talent and the ensuing need to raise wages to recruit and retain their workforce.

Low Unemployment & Slower Job Growth

The U.S. economy added 164,000 jobs in July and posted an unemployment rate of 3.7%. July capped 106 months of continuous job growth – the longest stretch in the nation’s history. The unemployment rate dropped from 4% in January to just 3.6% in April and May. The slight increase to 3.7% in June and July was caused by more Americans joining the labor force, a sign of growing confidence in the labor market. There have been more than 7 million job openings posted each month so far this year, greatly outnumbering the unemployed.

Job growth averaged 165,000 new jobs per month in the first seven months of 2019, decreasing from the rate of 227,000 during the same period last year. The slowing rate is explained by some analysts as a sign that the economy may be running out of workers. However, a more verifiable cause is that trade uncertainties have stalled growth in goods-producing sectors, such as manufacturing, and this is causing a drag in the overall growth rate. The decreased rate of job creation has not raised significant concern because it is still comfortably higher than the approximately 100,000 new jobs required each month to meet the growth of the working-age population. 

Canada’s employment numbers in the first half of the year were mixed. After starting the year with two months of strong job growth, Canada posted a net job loss in March. In hindsight, this decrease appeared to be an anomaly when 107,000 jobs were added in April. However, the increase in jobs slowed significantly in May with only 27,700 new positions. In June, the Canadian economy posted a loss of 2,200 jobs, followed by a decrease of 24,200 payrolls in July, raising the unemployment rate to 5.7%.

In Europe, many economies posted strong job gains and continued low unemployment. The UK’s August Labour Market Report showed 425,000 more people working than one year earlier, with employment rates at or near record-highs throughout 2019. Brexit continued to consume much of the public’s attention after the March 31 deadline was missed. The rejection of Prime Minister Theresa May’s negotiated Brexit agreement led to her resignation. She was replaced by Boris Johnson, who campaigned heavily for Brexit during the national referendum. With the October 31 deadline growing closer every day, fears have increased that the UK will leave the European Union with a No Deal Brexit, causing the pound to stumble and generating calls for renegotiation with the EU.

Even with no clear way to forecast near-term economic conditions, the UK unemployment rate was at 3.9% during the April through June quarter. For other major European economies, the unemployment situation was mixed. The Eurozone’s unemployment rate was 7.5% in June, falling 0.3% from the end of the first quarter. France posted an unemployment rate of 8.7% in June, a decrease from the first quarter, while Germany’s rate fell to the very low 3.1%.

In the Asia-Pacific region, unemployment rates in leading economies mostly remained at extremely low levels. During the second quarter, China reported an unemployment rate of 2.6%; in June, Japan was at 2.3%, Hong Kong at 2.8% and South Korea fell to 4%. In contrast to the steadily decreasing unemployment rates of other leading economies, India’s unemployment rate rose to 7.9% in June.

Other APAC economies posted mixed employment numbers. Australian unemployment fell to 4.9% in February, the lowest in eight years. However, it has been higher ever since, ending the first half of 2019 in June at 5.2%, which held steady in July. New Zealand reported that its unemployment rate had fallen to 3.9% in the second quarter of this year, down from 4.3% at the end of 2018.

Wages Rise with Demand for Talent

When wages rise faster than the rate of inflation, households are able to increase their spending power, which, in turn, can benefit the economy as a whole. Wage increases have outpaced inflation in much of the developed world so far this year. When the supply of talent remains as low as it has in many of the world’s largest economies, employers raise wages with the hope of recruiting new workers and keeping those they already have.

The U.S. annual wage increases stood at 3.2% in July, well above the 1.8% annual inflation rate. In the UK, nominal regular wages rose to 3.9% in June. This robust wage increase can be explained at least in part by an extended period of low unemployment. When unemployment in the UK stood at 4% in August of 2018, the annual wage increase rate was just 3.1%. But, after 10 months of sustained low unemployment and a decrease of just 0.2%, the rate of annual wage increases rose by 0.7%.

In two other major English-speaking economies, wage growth was both more modest and uneven. Canada posted anemic growth rates in much of the first half of 2019, reporting annual weekly wage gains of just 2.1% in May before jumping dramatically to 3.6% in June and rising again in July to 4.6%. 

In Australia, annual wage growth remained at just 2.3% for the 10 months leading up to June 2019. After instituting a new law on July 1, Australia has the highest minimum wage law in the world. Australian wages are considered to be high in relation to comparable economies and some posit that the already-high wages blunt the demand for pay increases. Another reason offered for its comparably low rate of growth is Australia’s relatively high unemployment rate. Wages have grown much faster this year in the U.S. and UK, where unemployment rates are below 4%, while Australia’s wage growth has stalled with unemployment rates above 5% for much of the year.

Call the Matchmaker? The Evolving State of Talent Supply & Demand

Indeed’s Hiring Lab studied labor markets in four key economies – the U.S., the UK, Australia and Canada – for the past five years. Indeed leveraged its extensive job posting and résumé data to research how the distribution of job listings has evolved in these four markets and how successful job-seekers were in keeping up with changing demands for talent.

Key findings included:

  • With improving labor markets, smaller overall talent pools are the challenge for employers, not poor matches between job-seekers and available positions.
  • Overall, new job opportunities are changing at a similar pace across countries.
  • Tighter labor markets are associated with lower mismatch between job-seekers and the types of positions employers are trying to fill.

Why does the mismatch rate between job candidates and job postings decrease when labor markets improve? Indeed offers the example of a construction worker applying for jobs during a recession when construction jobs are scarce. With few construction jobs available, this unemployed worker would need to look to other sectors – such as retail – to find work. Once the labor market strengthens, more construction job opportunities open up, increasing the chances of matching a job for which they are qualified. When the job market improves overall, so does the level of candidates matching the jobs being offered.

However, a greater rate of matching between job-seekers and job postings driven by an improved labor market is not necessarily a panacea for employers:

“In a tight labor market, employers see relatively few candidates compared with the number of jobs available,” the report stated. “All that declining mismatch indicates is that the candidates employers are seeing are better suited for posted jobs than applicants were a few years ago. Overall, it’s hard to find workers when unemployment is so low. And, that’s particularly true for roles that are chronically tough to fill, such as some nursing or tech positions. But, when hiring is so competitive, the challenge of finding workers isn’t confined to those tough-to-fill roles.”

And, while mismatch rates have improved, they are still significantly high in all four countries. Australia has the highest rate at approximately 50%, while the mismatch rate is roughly a third in the U.S., 40% in the UK and just below 30% in Canada.

The research illustrates that, even in the best-case scenario, one in four active job-seekers are mismatching with the jobs being posted. With demand at or near historic highs, this can lead some employers to bring on those without the right skills and experience to succeed, potentially leading to increased training costs and higher turnover.

PeopleScout Australia Jobs Report Analysis – July 2019

Australia’s economy added 41,100 jobs in July, beating analyst expectations. The unemployment rate held steady at 5.2% as labour participation increased. The Bureau of Statistics reports that full-time employment increased by approximately 34,500 and part-time employment rose by close to 6,700.

July 2019 (August Report) Unemployment rate – Seasonally Adjusted: 5.2 percent (Sideways Arrow) Jobs Change: +41,100 Labour Force Participation: 66.1 per cent (Up Arrow) Business Confidence Index: +4 (Up Arrow) Sources: http://www.abs.gov.au/ https://business.nab.com.au https://www.businessinsider.com.au/ https:/abc.net.au https://business.nab.com.au/ Summary: Australia’s economy added 41,100 jobs in July, beating analyst expectations. The unemployment rate held steady at 5.2% as labour participation increased. The Bureau of Statistics reports that full-time employment increased by approximately 34,500 and part-time employment rose by close to 6,700.

Numbers

41,100: The Australian economy added 41,100 jobs in July.

5.2%: The Australian unemployment rate remained at 5.2%.

66.1%: Labour force participation rose at 66.1%.

+4: The Business Confidence Index rose to +4 in the latest NAB release.

Upside

After an initial report of only 500 net jobs added in June, the Australian economy gained 41,100 jobs in July, easily beating analyst expectations of 14,000. The unemployment rate did not decrease because the labour force participation rate rose to 66.1%, a record high. At this peak level of participation, approximately two out of every three Australians of working age are either currently employed or looking for work. The number of those employed in Australia has grown by 2.6% over the last year.

The states with the largest employment increases in July were Queensland with 19,900, New South Wales with 13,000 and Victoria with 3,600.

Downside

Despite the impressive job growth in July, unemployment rolls grew by 800. There was a reversal of fortune for Western Australia. In June, every state except Western Australia posted job losses. But in July, it had the nation’s largest number of jobs lost, decreasing by 4,200. The wage figures released this week showed continued stagnation with an annual rate growth of just 2.3% in the second quarter. This rate has not changed since the third quarter of 2018. It is thought that anemic wage growth was an important factor in RBA’s recent interest rate cut to a record low of 1%.

This deadlock in wages is generating speculation that additional interest rate cuts may be necessary since market forces alone are not boosting economic conditions:

“The data largely confirms the RBA’s view that spare capacity is limiting upward pressure on wages, and the economy needs to generate more jobs to absorb the extra workers,” said Sarah Hunter, chief economist at BIX Oxford Economics. “Given this, we still expect the Board to cut the cash rate again this year, to 0.75% and possibly one more time in early 2020.”

While some analysts do not predict robust action by the RBA, they caution that weaker job growth and higher unemployment is on the horizon. Marcel Thieliant from Capital Economics expressed doubts that the job growth reported in July can be sustained:

“The strong rise in employment in July suggests the RBA won’t be in a rush to ease policy further, but we think it won’t be long before the unemployment rate starts to rise again,” he wrote.”Employment surveys suggest that jobs growth could slow to around 1% by the end of the year. That’s consistent with our forecast that the unemployment rate will climb to 5.5% by the middle of next year.”

The Future of Jobs in Australia

The latest figures from the Department of Employment predicts the employment outlooks for job titles for the five years spanning May 2018 to May 2023. Some of the notable forecasts include:

  • Overall employment is predicted to grow by 7% or 886,100 jobs with a significant number of these likely to be part-time.
  • Intelligence and policy analyst jobs will increase by more than a third to 40,200 in the five years from May 2018 to May 2023.
  • The number of secretaries during the same period will decline by 13,600, or almost one third of the current number.
  • The steepest growth will be in the relatively low-paid aged and disabled care sector with their workforce expected to rise to 245,000 by 2023, an increase of 39%. This strong growth is being driven by Australia’s aging population.
  • The Department of Employment predicts a need for 11,300 extra psychologists by 2023.

The sectors which will experience the greatest growth are healthcare and social assistance; construction; education and training and professional, scientific and technical services. In fact, the Department of Employment predicts that two out of every three new jobs created will be generated by these sectors. 

The reasons given for growth in these areas are:

  • An ageing population, the NDIS (Australia’s National Disability Insurance Scheme) and growing demand for childcare and home-care based services are driving jobs growth.
  • Investment in infrastructure (like roads, railways and airports) means jobs will continue to grow in the engineering construction sector. Workers will also be needed to build homes for our growing population.
  • The number of school-aged children is growing, and there is strong demand for adult and community education. More people are working part-time and in non-teaching support roles.
  • Demand is growing for qualified workers, especially in computer system design and the management and consulting services sectors.

Those hoping to work in the jobs being created over the next few years should take the steps to acquire the necessary skills to succeed in them, and those planning to employ them should consider designing their recruitment strategies with a focus on the institutions providing them with the education and certifications to make them employable. Despite some strong growth in jobs that require little or no formal training, the Department of Employment predicts that over 90% of new jobs created will need “education beyond school and some jobs will need more training than they used to. Many professional and service roles demand university or VET (Vocational Education and Training) qualifications.”

PeopleScout UK Jobs Report Analysis – August 2019

The August Labour Market Report released by the Office for National Statistics includes the quarter covering April 2019 through June 2019. In the quarter, 115,000 jobs were created. Nominal annual regular wage increases rose to 3.9%, the highest level in 11 years. The unemployment rate rose to 3.9% as more people in the UK joined the labour force.

UK jobs report infographic

Notable figures from the August report include:

  • The UK employment rate was estimated at 76.1%, tying the highest level on record since comparable records began in 1971.
  • Estimates for the second quarter show 32.81 million people aged 16-years and over in employment. This is a record high and 425,000 more than for a year earlier. This annual increase of 425,000 was mainly because of more people working full-time (up 262,000 on the year to reach 24.11 million).
  • Part-time work also showed an increase of 162,000 on the year to reach 8.70 million.
  • For May to July 2019, there were an estimated 820,000 job vacancies in the UK, 20,000 less than a year earlier and 20,000 fewer than for the previous quarter (February to April 2019).

A Strong Report Muted By Dim Forecasts

The 115,000 jobs gained in the quarter were almost twice the number that analysts had predicted. With the October 31 Brexit deadline looming ever closer, much of the vibrant hiring activity is being attributed to employers choosing to hire workers now that can be laid off later instead of making long-term investments in their businesses.

The positive job numbers were clouded by last week’s announcement that the UK economy had shrunk for the first time in almost seven years. The economic contraction was blamed primarily on stockpiling preceding Brexit and a weakening global economic environment.

Recent private-sector surveys have indicated that employers are becoming increasingly cautious in their hiring plans due to the potential of a no-deal Brexit. The Bank of England has also noted this month that while the labour market remains tight, there are signs that growth is slowing. Tej Parikh, chief economist at the Institute of Directors summed up much of the analysis of the report: “The jobs market remains a source of strength for the UK economy, though it may now be reaching its peak.”

Key Signs of Economic Strength

Despite warnings of things to come, there were strong economic indicators in the August report. Among the bright spots were the growth in wages and the drop in economic inactivity. The growth in regular nominal wages grew to 3.9%, three-tenths of a percentage point over the last report. Average annual weekly pay including bonuses increased 3.7%. These are the highest rates posted since 2008. With wage increases strongly outpacing the rate of inflation, UK households can translate these pay increases into greater purchasing and investment.

The economic inactivity rate is the measure of those without a job but who are not classed as unemployed because they have not actively sought work within the last four weeks and/or they are unable to start work within the next two weeks. For people in the UK aged from 16- to 64-years, during the April to June 2019 quarter, the estimated economic inactivity rate was 20.7%, tying a record low. Economic inactivity was just 16.3% for men and a record low of 25.1% for women. These historically low rates indicate that the extended strength of the job market has pulled in those who may have remained economically inactive in the past due to increased confidence of finding work.

Zero Hours Workers, An Untapped Talent Source?

Nearly 1 million people in the UK are now working with zero-hours contracts. The 896,000 who are employed with this type of contracts has increased 15% over the last year. The UK government defines zero-hours contracts as:

“Zero-hours contracts are usually for ‘piece work’ or ‘on-call’ work, for example for interpreters.

This means:

  • they are on call to work when you need them
  • you do not have to give them work
  • they do not have to do work when asked

Zero-hours workers are entitled to statutory annual leave and the National Minimum Wage in the same way as regular workers.

You cannot do anything to stop a zero-hours worker from getting work elsewhere. The law says they can ignore a clause in their contract if it bans them from:

  • looking for work
  • accepting work from another employer”

Those working with zero-hours contracts span the age demographic of the nation’s labour force. The number of zero-hour workers aged 65 or over increased by 30% in the last year, and the proportion of 16- to 24-year-old workers on zero-hours now stands at 8.8%.

While many zero-hours workers may prefer the flexibility that their contracts provide, there are certainly others that would prefer the stability and consistency of pay generated by a full-time job. Given that there are more than 800,000 job vacancies in the UK and that zero-hours workers now represent approximately 1 in 40 of those working in the country, there may be a vast pool of talent which has not yet successfully been tapped. Employers struggling with hiring from this pool should consider engaging a recruitment process outsourcing company which can provide the competitive edge in attracting talent at all levels of engagement in the workforce.

PeopleScout Canada Jobs Report Analysis — July 2019

Statistics Canada reported that the nation’s unemployment rose to 5.7%. In July, the economy shed 24,200 jobs. Weekly annual wage increases were up 4.6%, an increase of an entire percentage point from the previous month. The report showed that between May and July, Canada only added an average of 400 jobs per month.

canada jobs report infographic

The Numbers

-24,200: The economy lost 24,200 jobs in July.

5.7%: The unemployment rate rose to 5.7%.

4.6%: Weekly wages increased  4.6% over the last year.

The Good

Statistics Canada reported that compared with July 2018, employment increased by 353,000 employed Canadians or 1.9%. The annual increase was fueled by gains in full-time work which increased by 326,000 or 2.2%. Annual wage gains jumped to 4.6% at the weekly level from 3.6% in June. Annual hourly wages increased by 4.5%, the highest level since January 2009.

After two months of negligible changes in the labour market in Quebec, employment rose by 17,000 in July, with healthy increases in manufacturing and construction. The unemployment rate was unchanged at 4.9% because more Quebecers entered into the labour force. Year over year, employment in Quebec increased by 96,000 or +2.3%.

For the nation as a whole, construction jobs grew by 25,000 in July. About 9,200 more Canadians were working in public administration than in June, primarily due to increases in Ontario.

The Bad

The Canadian economy shed jobs for the second month in a row. In the May-July quarter,  Canada only added an average of 400 jobs per month. There were job losses in Alberta, Nova Scotia and New Brunswick. After two months of increases, jobs fell in transportation and warehousing by 15,000. The number of private-sector employees decreased by 69,000 in July, primarily from losses in the wholesale and retail trade. 

Some analysts pointed to the weak July job numbers as evidence that the Canadian labour markets is beginning to weaken. Brendon Bernard of Indeed Canada noted:

“While still in decent shape overall, the job market clearly has lost some momentum. It’s discouraging to see employment growth lose steam amid recent signs of turmoil in the global economy.”

The Unknown

There has been a significant shift in the age demographics of the Canadian workforce in recent years.  HRD Canada reports that there are roughly the same number of Canadian workers who are aged 25 to 34  as there are 55 and older. in 1996, older workers made up just 10% of the workforce. But by 2018, this percentage more than doubled to 21%.  

Statistics Canada reports that while the proportion of older workers has increased  throughout the Canadian economy, the shift in the healthcare sector is particularly notable:

“Healthcare and social assistance was the largest industry in Canada in 2016, accounting for 2.3 million or 13%, of all workers. This industry also had one of the most rapid growth rates in the number of workers from 1996 to 2016 (+68%).

Despite the rising demand for health care services, workers who are providing health care to an increasingly older population are themselves aging. For instance, among registered nurses and registered psychiatric nurses—the largest occupation related to health care—about 1 in 5 was aged 55 and older in 2016, compared with less than 1 in 10 in 1996.

In 1996, there were 4.5 female nurses aged 25 to 34 for each female nurse aged 55 and older. By 2016, that ratio had declined to 1.6.

Similarly, specialist physicians had one of the largest shares of older workers at 31% in 2016, compared with 23% in 1996.”

While Canadian employers may have to plan for more than 20% of their workforce reaching retirement age in the next ten years, they will most likely avoid the challenge of workers retiring early. Benefits Canada reports that an increasing number of Canadians aged 60 and over are staying in the workforce with 90% of those in this age group working in some capacity.

Canadian employers face the challenge of leveraging the experience and skills of their older workers while putting effective succession plans in place to prepare for the high levels of retirement to come. An important part of succession planning is a recruitment strategy that onboards new talent in time to receive training and mentorship from older workers who have contributed to the success of an enterprise. The expertise provided by a recruitment process outsourcing company can help organizations institute talent acquisition programs that take succession planning into account while providing solutions for immediate hiring needs.

PeopleScout New Zealand Jobs Report Analysis — June Quarter 2019

Stats NZ released the June Quarter Labour Market Report which reported that unemployment fell to 3.9% in the second quarter, down from 4.2% in the last quarter. The last time the unemployment rate was this low was mid-2008. 

nz jobs report infographic

The Numbers

+21,000:  The economy gained 21,000 jobs in the second quarter of 2019.

3.9%: The unemployment rate fell to 3.9%.

2.1%: Overall wages increased  2.1% over the last year.

The Good

After posting job losses in Q1, 21,000 jobs were created in the second quarter. The sectors which had the greatest job gains in the quarter were retail trade, accommodation and food services with an additional 10,100 positions and education and training with 9,300 new jobs. Compared to a year earlier, 45,000 more people are now working in New Zealand. 

Overall wages grew by 2.1% over last year, one tenth of one per cent over the annual increase posted in the first quarter. The seasonally adjusted underutilisation rate fell to 11.0% this quarter, down from 11.3% in March 2019. This is the lowest rate of underutilisation since the September 2008 quarter, when the underutilisation rate was just 10.5%.  

The Bad

The slight lift in the June quarter’s wage increase is being attributed to the new minimum wage law which took effect on April 1. While there was job growth in most sectors, manufacturing lost 6,700 positions. Analysts note that while the labour market is strengthening, indicators point to slowing growth in the future:

“ASB chief economist Nick Tuffley said the labour market had tightened, but he was cautious because all the signs have been pointing to a slower economy.

‘More timely indicators suggest the worm has turned for the labour market. The broader economic slowdown now looks entrenched, and will likely translate into additional labour market slack ahead.’”

State of the New Zealand Workforce

In July, Stats NZ released The Survey of working life 2018, conducted between October and December 2018. Employed people were asked about their work arrangements, employment conditions and satisfaction with their job and work-life balance. The report attempts to create a picture of what working life is like in New Zealand.

The report showed that a majority of New Zealanders are generally satisfied with their work life. But as NZ Business notes, flexibility and work/life balance play an important role in employee contentment, and employers need to be vigilant in these areas or they risk losing talent:

“It’s great to hear that the vast majority of Kiwis are happy with their work lives, showing that employers are definitely getting things right. This is no time for them to sit back though because unless they continue to focus on key areas that make a significant contribution to their people’s satisfaction in their job, they risk losing them.

The Statistics NZ Survey of working life: 2018 of just under 10,000 people showed that 88 percent of people employed – in all sectors and business sizes – were either satisfied or very satisfied with their job. That’s impressive, as is the fact that half of employees had flexible work hours. That links directly with job satisfaction and people feeling like they have a better work/life balance.”

Additional key findings in the report include:

  • Half of employees had flexible work hours, allowing them to start and finish work at different times each day.
  • Almost two out of five employees worked in jobs where their hours of work often changed to suit their employer’s needs.
  • Two-thirds of employed people had worked at a non-standard time at least once in the last four weeks. (Non-standard times includes any hours worked outside of 7 a.m. to 7 p.m., Monday to Friday.)
  • Almost one in 10 employed New Zealanders have more than one job. This equates to 222,900 people.
  • Temporary employees make up 9% of all employees which is 201,300 people, and half of them want a permanent job.
  • A quarter of employed people had been in their job for 10 or more years, and an additional 17% had been in their job for between five and ten years.
  • Six out of ten employees undertook work-related training in the last 12 months.
  • The majority of employed people (57%) felt that the skills they have match well with the skills required for their job.

PeopleScout U.S. Jobs Report Analysis — July 2019

The Labor Department released its July jobs report which shows that U.S. employers added 164,000 jobs in July, in line with many analyst expectations. The unemployment rate stayed at  3.7%. Year-over-year wage growth grew to 3.2%, well ahead of the rate of inflation. U.S. employers have added to payrolls for 106 straight months, extending the longest continuous jobs expansion on record.

us jobs report infographic

The Numbers

164,000: The economy added 164,000 jobs in July.

3.7%: The unemployment rate remained at 3.7%.

3.2%: Wages increased at a rate of 3.2% over the last year.

The Good

The longest continuous job expansion in the nation’s history extended another month with 164,000 new jobs added to the economy. The unemployment rate remained at 3.7%, a figure close to historic lows. Year-over-year earnings increased to a healthy 3.2%.

There was also good news for those who were working part-time out of economic necessity. The number of persons employed part-time for economic reasons (sometimes referred to as involuntary part-time workers) declined by 363,000 in July to 4.0 million. These individuals, who would have preferred full-time employment, were working part-time because their hours had been reduced or they were unable to find full-time jobs. Over the past 12 months, the number of involuntary part-time workers has declined by an impressive 604,000.

Among the marginally attached, there were 368,000 discouraged workers in July, down by 144,000 from a year earlier. Discouraged workers are those not currently looking for work because they believe no jobs are available for them. The remaining 1.1 million persons marginally attached to the labor force in July had not searched for work for reasons such as school attendance or family responsibilities. The decrease in discouraged workers reflects that confidence that enough jobs have been created to lure these individuals back into the workforce.

The Bad

The rate of job growth is definitely slowing. Over the first seven months of the year, the economy added 165,000 jobs a month, on average, below 2018’s average monthly pace of 223,000. The July report also shows a fall in the number of hours worked. The average workweek for all employees on private nonfarm payrolls decreased by 0.1 hour to 34.3 hours in July. In manufacturing, the average workweek decreased by 0.3 hour to 40.4 hours, and overtime declined by 0.2 hour to 3.2 hours. The decline in manufacturing hours can be attributed to uncertainty caused by the tariffs on foreign goods which have been growing on key trading partners like China.

While this slowing rate of growth may not be a cause for concern, the slowing rate combined with reduced hours has provoked pessimistic responses from some analysts:

“If I were to give a grade to the July employment report it would be a gentlemen’s C: Three-month average has declined to 140K, the downward revisions to May and June, and that decline in hours worked, which impacts your median household, is not encouraging.”

The Unknown

While 106 months of continuous job expansion is certainly viewed as good news for American workers, this extended job growth has increased competition among employers for increasingly scarce talent. One sector that has been most impacted by the tight labor market is hospitality. As the New York Times reported on the challenges employers face as part of its reporting on the July jobs report:

“A survey of business owners last month by the National Federation of Independent Business found job creation remains at a historically high level.

Ask pretty much any general contractor, hospital leader or restaurant owner about his or her biggest headaches, and a lack of qualified workers comes up.

‘Ten percent of our positions are always open,’ said Ignacio Garcia-Menocal, a co-founder and chief executive of Grove Bay Hospitality, which operates several celebrity-chef restaurants and employs 450 people. With two restaurants opening soon, Mr. Garcia-Menocal said he was looking to hire 40 to 50 people, from dishwashers who start at $10 an hour to general managers, whose salaries can range from $70,000 to $90,000 a year.”

It is unclear how long many businesses can continue operating normally with job vacancy rates at 10% or even higher. In the short term, these businesses could incur higher overtime costs and increased wage demands as they ask their employees to perform at greater efficiency. In the long-term, many enterprises will need to re-think their recruitment and retention strategies if they want to remain profitable in the most challenging labor market in recent memory.