Global Economic Snapshot – Q1 2019

The strong job growth and tight labor markets which characterized most of the world’s leading economies in 2018 continued in the first quarter of 2019. And while the overall economic headlines have been positive, employers have been challenged by record high job openings, rising wages and uncertainty over trade. For many economies, 2019 got off to a strong start, but the outlook for the remainder of the year is uncertain.

Low Unemployment: The Diminishing Available Talent Pool and a Tight Labor Market

The United States ended the first quarter with an unemployment rate of just 3.8%. While the partial government shutdown may have impacted the negligible job growth in February, the economy still added an average of 180,000 jobs per month in the first quarter. This is robust job growth by any measure, but it is smaller than the 223,000 jobs created per month in 2018. These numbers suggest that job growth is still strong but the pace of job creation is slowing.

U.S. employers posted nearly 7.6 million open jobs at the start of the year, a near record high and a sign that businesses are continuing to compete for a diminishing pool of available talent. In March, it was estimated that there were about 1 million more open jobs than unemployed workers.

In contrast to its North American neighbor, Canada’s employment situation was mixed. The first quarter ended with an unemployment rate of 5.8%, but after two strong months of job gains, Canada lost jobs in March.

In Europe, many leading economies posted strong job gains and low unemployment. In the UK, the March Labour Market Report showed that a greater percentage of people in the UK were working than at any time since comparable records were kept. As a result, the unemployment rate in the UK plunged to 3.9%, the lowest rate since 1975. For other major European economies, the unemployment situation was mixed. The Eurozone’s unemployment rate was 7.8%, slightly lower than at the end of 2018. France posted an unemployment rate of 8.8% during the quarter while Germany recorded its unemployment at a very low rate of 3.3%.

In the Asia-Pacific region, unemployment continued to be negligible in the leading Asian economies. During the first quarter, China reported an unemployment rate of 3.8%, Japan was at 2.3%, Hong Kong at 2.8% and South Korea at 4.7%. India’s unemployment rate of 6.7% was slightly higher than a year earlier.

Other APAC economies posted strong employment numbers. Australian unemployment fell to 4.9%, the lowest level in eight years, and New Zealand reported that the unemployment rate had risen to 4.3% in the final quarter of last year.

Low unemployment has led employers to compete for a diminishing pool of available talent and has made it even more necessary to retain workers who may be lured by competitors offering higher wages and other incentives.

Wages Rising but Inflation Remains Low

The conventional wisdom holds that wages rise when the supply of workers is low. Yet, wage increases have grown very gradually even in economies with very low unemployment. One of the reasons for this is that inflation rates in many advanced economies are quite low, so even modest wage increases can have a positive impact on a household’s ability to spend and save. In some economies, wages began to rise significantly in 2018 and continued in 2019. In the U.S., annual wage increases rose to 3.4% in February before contracting slightly to 3.2% in March. Coupled with an inflation rate of just 1.5%, wage increases in the U.S. are growing more than two times as much as the price of goods and services. In the UK, the annual wage increase of 3.4% was still well above the inflation rate of 1.9%

In two other major economies, the wage growth picture is not as positive. Canada was posting year-over-year wage growth of more than 3% in mid-2018, but by March 2019 the average year-over-year wage growth for permanent employees was just 2.3%. While Canada’s inflation rate was 1.5%, the same as the U.S., Canadian workers benefited less than their U.S. counterparts from their wage increases.

In Australia, wage growth was just 2.3% in 2018 and some estimate that Australians are experiencing their lowest increase in pay since World War II. With inflation running at 1.8%, workers are still coming out ahead, but not as much as in the U.S. or UK. The reasons for the difference in wage growth among these four Anglosphere economies are rooted in the structures of the individual economies. Slow wage growth has contributed to low inflation in each country, but as wages rise, so does the possibility of an increase in inflation. If inflation increases, there would be even greater incentive for workers to change jobs to increase their income and for employers to respond by offering higher wages.

High Anxiety – Trade and Jobs

In North America, NAFTA, the agreement which has tied the economies of Canada, the United States and Mexico, was set to be replaced by the new USMCA treaty. The treaty was signed by the heads of all three countries late last year but it has not yet been ratified by any of their respective legislatures. The uncertainty due to the lack of clear tariff regimes in the near future may cause considerable disruption in different sectors in each economy. In the U.S., manufacturing, a sector which may be most impacted by North American trade, lost jobs in March for the first time since 2017.

But any concerns in North America pale in comparison to anxiety over Brexit. As of the time of publication, the UK is set to leave the European Union on October 31, 2019. There remains a possibility that the UK will exit the EU without any agreement and possibly experience economic chaos.

If and when Brexit occurs, it has already had an impact on the UK workforce, especially in the area of foreign workers. The Guardian reports:

“There were an estimated 2.33 million workers from the EU27 in the UK between October to December in 2017, but that figure dropped to 2.27 million a year later. A notable drop in workers from A8 countries, which joined the bloc in 2004 and include Poland and the Czech Republic, largely accounted for the decrease. It contrasted with an increase in the number of non-EU workers in the UK, rising from 1.16 million to 1.29 million in the same period. This was an increase of 130,000 compared with the equivalent period 12 months earlier, and the highest number since records began in 1997.”

The Guardian

Given the importance of workers from the EU in sectors such as healthcare, hospitality and meatpacking, a continued exodus of workers from the EU will have a major impact on key UK industries.

With so much concern over the economic future, why have the job numbers in the UK been so positive? While it may simply be a matter of filling the demand employers have for talent, Bloomberg suggests a more somber reason:

“One explanation for the resilience of the labor market is that firms are hiring workers rather than spending on capital equipment because employment decisions are easier to reverse in a downturn.”

Bloomberg

In other words, newly hired workers are more expendable in an economic downturn than capital equipment, a sobering thought for both employers and workers during these uncertain times.

PeopleScout UK Jobs Report Analysis – April 2019

The April Labour Market Report released by the Office for National Statistics posted record-breaking numbers for the nation’s labour market. In the three months covering December 2018 through February 2019, the highest level of people were working in the UK since comparable records have been kept. Nominal wages rose by 3.4%, the same as last month. This wage level reported in the last two months is the highest year-over-year level in over a decade.

UK Jobs Report – April 2019

The Numbers

  • The number of people working in the UK rose by 179,000 to 32.72 million. This is the highest figure since records began in 1971.
  • The unemployment rate held at 3.9%, excluding last month’s report, this is the lowest rate since 1975.
  • The UK economic inactivity rate was estimated at 20.7%, with 213,000 fewer inactive individuals than a year earlier.
  • Compared to a year earlier, 457,000 more people were working in the UK.
  • The employment level for men was estimated at 80.5%; it has not been higher since December 1990 to February 1991. For women, the employment level was estimated at 71.8%, the highest level on record. (The increase in the employment rate for women in recent years is due partly to changes to the state pension age for women, resulting in fewer women retiring between the ages of 60 and 65 years.)

After a Brexit Extension is Granted There is Good News for the Labour Market

The European Union extended the date for the UK’s formal exit (Brexit) to October 31, 2019. This labour market report covers a period when Brexit was expected to take place at the end of March. While there is no more clarity about what Brexit will look like, if it happens at all, the good news about the labour market was greeted with less anxiety than in previous months when Brexit appeared to be nearly imminent.

Much of the good news was due to a decrease of workers from the EU and the increase in women in the nation’s workforce as the Financial Times reports:

“Britain’s jobs market has been robust despite wider concerns about the future of the economy after Brexit. With unemployment at the lowest rate since 1974 and fewer workers coming from the EU, UK businesses have sought new sources of labour. ‘The growth in employment was driven mainly by the number of women getting into jobs,’ the Office for National Statistics said. Its latest labour market data showed women accounted for 80% of the 179,000 increase in employment during the three months…”

The Financial Times notes that patterns of recruitment are changing for some employers reflecting the increased level of women in the workforce and a post-Brexit environment:

“Last month, budget hotel chain Travelodge said it was targeting working mothers with new shift patterns to manage Brexit-related staffing shortages. Amber Rudd, work and pensions secretary, said it was ‘particularly pleasing to see there are now a record number of women in work and a record number of people with secure, full-time jobs.’”

Record Job Openings are a Challenge for Employers

The high number of job openings is a fundamental component in the difficult environment that UK employers find themselves. Commenting on the April Labour Market report, Suren Thiru, Head of Economics at the British Chambers of Commerce (BCC), commented:

“The strong increase in employment, coupled with another fall in the number of people out of work, suggests that the UK labour market remains in good order.However, behind the strong headline figures, a number of key challenges remain. Businesses are increasingly reporting that persistent hiring difficulties, cost pressures and ongoing uncertainty are dampening recruitment intentions. If this trend is sustained it could well translate into a weakening in UK jobs growth over the next year. Pay growth continues to comfortably outstrip price growth, and in real terms is likely to remain in positive territory for some time to come. However, the combination of a sluggish economy, weak productivity and high upfront costs for business is likely to limit the extent of pay rises. The record high number of job vacancies is further confirmation of the perennial skills shortages plaguing UK businesses, which continues to hold back business activity and growth. To protect the long-term health of the UK labour market, businesses need answers to key questions on how firms will be able to manage their future workforce needs over the next few years. Brexit has distracted government and Westminster for too long, much more must be done at home to address the UK’s chronic skills shortage, including easing the burden of upfront business costs to help firms to hire and train staff.”

More than at any time in recent economic history, it is clear that those enterprises that have a strong employer brand as well as a solid recruitment and retention program will be the clear winners in this difficult market.

Temporary Workers – An Overlooked Source of Talent?

Of the 1.54 million temporary employees during the period ended February 2019, more than a quarter were temporary because they could not find a permanent job. These workers could be in positions where they have the skills to do their jobs but have been unable to find full-time work. Of course, geographic and other factors may play a part in their inability to find full-time work, but with so many permanent job openings available, there appears to be a disconnect between employers and this large pool of talent. As the Guardian notes:

“..Nor is there much evidence of a big switch to the hiring of temporary workers in the three months to February – a period when Brexit uncertainty was ratcheting up. The 179,000 increase in employment was split 138,000 full-time and 41,000 part-time. Self-employment was down by 23,000.”

The Guardian

Employers that can successfully recruit from this large pool of temporary workers could have an important advantage in filling their open positions and have a competitive edge in attracting increasingly scarce available talent.

PeopleScout Canada Jobs Report Analysis — March 2019

Statistics Canada reported that the nation’s unemployment remained at 5.8% and that the nation lost 7,200 jobs in March after two months of healthy job gains. Market expectations were for an increase of 10,000 jobs. The March employment report showed the number of full-time positions contracted by approximately 6,400, whereas part-time jobs were roughly unchanged, with a net decline of approximately 900. Weekly annual wage increases were up 2.2% and hourly wages increased by 2.4%. The increase in wages still falls short of the wage growth in mid-2018.

Canada Jobs Report – March 2019

The Numbers

7,200: The economy lost 7,200 jobs in March.

5.8%: The unemployment rate remained at 5.8%.

2.2%: Weekly wages increased 2.2% over the last year.

The Good

While the March Labour Market report released by Statistics Canada showed net job losses in March, the first quarter of 2019 saw 116,000 jobs added to the economy. On a year-over-year basis, employment grew by 332,000 (+1.8%), with gains in both full- (+204,000) and part-time (+128,000) work. Over the same period, total hours worked rose by 0.9%.

Despite the results in March falling below analyst expectations, the news was not received with particular concern:

“We got a little dip in employment, but the numbers are volatile and it’s been on a pretty strong run over the prior half year,” said Nathan Janzen, senior economist at Royal Bank of Canada.

Analysts said the small decline in March, following six months of consecutive gains, was unlikely to alter the Bank of Canada’s view of employment as a bright spot in Canada’s economy.

“After such a strong run of employment gains, a modest pull-back in March is of little concern to us and won’t raise many eyebrows at the Bank of Canada either,” said Andrew Grantham, Senior Economist at CIBC Capital Markets, in a note.”

The March reports also showed that more Canadians were working in the finance, insurance, real estate, rental and leasing industry and in public administration.

The labour market continued to improve in terms of wage increases. Annual hourly wage gains accelerated to 2.4% in March, the fastest annual gain since September, up from 2.3% in February. Pay gains for permanent employees rose to 2.3%, the strongest increase since August.

The Bad

Although the losses were modest, the March report was the first to report a decrease in jobs in seven months. Employment declined in health care and social assistance; in business, building and other support services; and in accommodation and food services. Canada’s two most populous provinces, Ontario and Quebec, lost jobs March.

While wage growth continues to pick steam, the rate of increase is smaller than in mid-2018. Concern over low wage growth was reflected in a recent poll conducted on behalf of  Indeed Canada which showed that  more than half of those surveyed plan to ask for a raise in 2019:

“Conducted by Censuswide on behalf of job site Indeed Canada, the research found that only 13% of Canadian workers surveyed are comfortable with their current rate of pay. That’s down from 17% from when Indeed commissioned the same survey one year ago.

The decline in salary satisfaction will prompt 53% of respondents to ask for more pay this year, the survey found.”

Widespread dissatisfaction over wages is a concern for Canadian employers because of pressure to raise salaries for their current workforce which may be prompted to look elsewhere to increase their incomes.

The Unknown

The US-Mexico-Canada (USMCA) trade agreement which was signed by the heads of state of the three respective countries has yet to be ratified by any of their legislatures. The agreement, which was created to replace NAFTA, could have a significant effect on important sectors in the Canadian economy.  However, it is unclear what a final version of the USMCA would look like and whether it will be implemented at all. The Canadian Foreign Minister warned that changes to the original agreement could lead to chaos:

“Canadian Foreign Minister Chrystia Freeland on Thursday cautioned against the idea of reopening a new continental trade pact with the United States and Mexico, saying it could be a ‘Pandora’s box.’

U.S. House Speaker Nancy Pelosi told Politico this week that changes needed to be made to the text of the United States-Mexico-Canada (USMCA) trade deal to ensure its labor provisions could be enforced.

‘When it comes to the issue of actually opening up the agreement, that’s where Canada’s view is, we’ve done our deal,’ Freeland told reporters on the sidelines of a NATO meeting in Washington when asked about Pelosi’s comments.

‘This was a very intense negotiation. A lot of time, a lot of effort went into it, compromises were made on all sides, and we believe that people need to be very careful around opening up what could really be a Pandora’s box,’ she added…

‘Canada has done its share, we have done our work, and now it’s up to each country to work on ratification,” said Freeland.

She reiterated that Canada could find it hard to press ahead with efforts to ratify the treaty as long as U.S. maintained tariffs on imports of Canadians steel and aluminum.”

PeopleScout U.S. Jobs Report Analysis — March 2019

The Labor Department released its March jobs report which shows that U.S. employers added 196,000 jobs in March, higher than analyst expectations. The unemployment rate remained steady at  3.8% last month. Year-over-year wage growth decreased to 3.2%, which is more than twice the rate of inflation which was 1.5% in February. U.S. employers have added to payrolls for 102 straight months, extending the longest continuous jobs expansion on record.

U.S. Jobs Report – March 2019

The Numbers

196,000: The economy added 196,000 jobs in March.

3.8%: The unemployment remained at 3.8%.

3.2%: Wages increases fell to a rate of 3.2% growth over the last year.

The Good

Due to the weak February job report numbers, the March report was highly anticipated and the strong numbers came as a relief to those who feared an economic slowdown. Not only were the 196,000 jobs added well above expectations, the February job increases were revised from 20,000 up to 33,000. The New York Times noted:

“Everyone can relax a little.

The solid job gains that have come to define the current economic expansion resumed in March. The gain in hiring, though widely forecast, will help clear some of the doubts hanging over the economy. Though the economy is expected to slow this year from the strong pace of 2018, Friday’s report was a welcome sign.”

The healthcare sector was among the job creation leaders in March adding 49,000 jobs last month and 398,000 over the past 12 months. Employment in professional and technical services grew by 34,000 in March and 311,000 over the last year. Payrolls also increased last month in transportation and warehousing, leisure and hospitality, and the financial sector.

While the unemployment rate remained unchanged, the broadest measure of underemployment, which also includes part-time workers who would like full-time work, has dropped to a level not seen since the early 2000s.

In addition to strong job growth, the number of people seeking U.S. unemployment benefits fell to its lowest level since late 1969. This is a sign that employers are retaining their workers despite fears by some of a slowing economy.

The Bad

Annual wage growth fell to 3.2% after hitting a near decade high in February. The decline in wage growth is coupled with a decrease in those participating in the labor force and extremely high job vacancies. As Reuters reports:

“There are about 7.58 million open jobs in the economy. Vacancies could remain elevated as 224,000 people dropped out of the labor force last month. The labor force participation rate, or the proportion of working-age Americans who have a job or are looking for one, fell to 63.0% in March from 63.2% in February, which was the highest in more than five years.”

The large number of open jobs is not consistently attracting more Americans to join the workforce which puts considerable pressure on employers to compete for talent.

Despite overall job gains for the economy, manufacturing shed jobs for the first time since mid-2017. Until last month, manufacturers had enjoyed their longest job creation streak since the 1990s. The retail sector shed 11,700 jobs last month, continuing a trend of decreased employment in this sector.

The number of those working in temporary help services also declined last month. This drop in the temporary help sector may have broader implications for the labor market in coming months. The Washington Post noted:

“The level of temporary workers, while still high, has stalled this year, another sign the economy might be cooling as widely expected, noted said Erica Groshen, a visiting scholar at Cornell University and former head of the Bureau of Labor Statistics, the nonpartisan agency that tabulates the jobs data.

‘The labor market is very strong…the only slightly yellow warning sign is temporary help,’ she said. ‘It’s a leading indicator that can be a harbinger that companies are slowing down hiring or take a pause.’

Businesses typically hire temporary workers when they want to expand their workforce quickly, but those workers are also often the first to go when firms try to cut costs.”

The Unknown

While the United States is enjoying a record run of job growth, there are indicators that some Americans are not optimistic that this trend will continue. A recent Conference Board survey elicited responses that mirror those given before the last recession. The Daily Herald reports:

“The survey, a widely followed gauge of consumer confidence produced by the Conference Board, a business research group, goes beyond asking respondents about the state of the economy. It also asks whether they think jobs in their area are ‘plentiful’ or ‘hard to get.’

The collective responses to those questions can foreshadow how job growth and the unemployment rate will move over time. When more people say jobs are plentiful and fewer say they’re hard to get, hiring typically rises and the unemployment rate falls. Wages are also more likely to increase.

‘It’s a good predictor of how the labor market evolves,’ said Joe Song, senior U.S. economist at Bank of America Merrill Lynch.

In July 2007, the percentage of Americans who said jobs were plentiful exceeded those who said they were hard to get by 11 points, indicating a good job market. The unemployment rate was a low 4.7% that month.

But the gap between the proportion of respondents saying jobs were plentiful and those saying they were hard to get then fell steadily – until it was barely positive in December that year, when the recession officially began. The unemployment rate remained at 4.7% or lower for four months before jumping to 5% in December and kept rising as the recession worsened.

The Conference Board’s measure plunged into negative territory in 2008 and 2009 as far more Americans said jobs were hard to get than plentiful. It bottomed at minus 46.1 in November 2009, one month after unemployment peaked at 10%, the highest rate in 26 years.

Similar downturns in the Conference Board’s data preceded previous recessions.

‘It is highly correlated with unemployment,’ Gad Levanon, chief economist at the Conference Board, said. ‘They have very similar turning points.’

The measure now indicates a sturdy job market but one that may weaken a bit. In March, far more Americans said they thought jobs were plentiful than hard to get, but the gap between the two narrowed by the most since the recession. The decline could still be a blip rather than evidence of job-market weakening, Levanon cautioned.”


The Importance of an Employer Value Proposition and Employer Brand Strategy

As employers face increasing competition for the best talent, a well-defined employer value proposition (EVP) and employer brand strategy have become more important than ever. In a candidate-driven market, employers need to stand out to their target talent audiences through a unified EVP and employer brand. High-quality candidates know what they want out of a future employer, and organizations that don’t effectively show their value to candidates risk losing them to the competition.

If you google EVP and employer brand, you’re likely to find thousands of definitions. At PeopleScout we define EVP and employer brand as the following:

  • Employer Brand: The perception and lived experiences of what it’s like to work for your organization.
  • Employer Value Proposition: Captures the essence of your uniqueness as an employer and the give and the get between you and your employees.

Both concepts revolve around the qualities that make a company a great place to work, as well as the benefits, career growth opportunities, work-life balance and company culture that attract top talent.

EVPs are particularly important in today’s job market, as a majority of candidates heavily evaluate companies before they even consider applying for open positions, and it can be a critical differentiator in a company’s ability to attract talent.

Key Elements of a Successful EVP

As HR Technologist explains, “An employee value proposition must be thoughtfully designed since it has a direct impact on behavior. It must look into the tangible and intangible elements of the psychological contracts between the employer and the employee. It must start way before the employee joins, even before the person is a job candidate; it must appeal to the person irrespective of whether the person intends to work with the organization or not.”

A successful EVP articulates the value that you offer to your employees. At PeopleScout, we establish three elements to support a successful EVP:

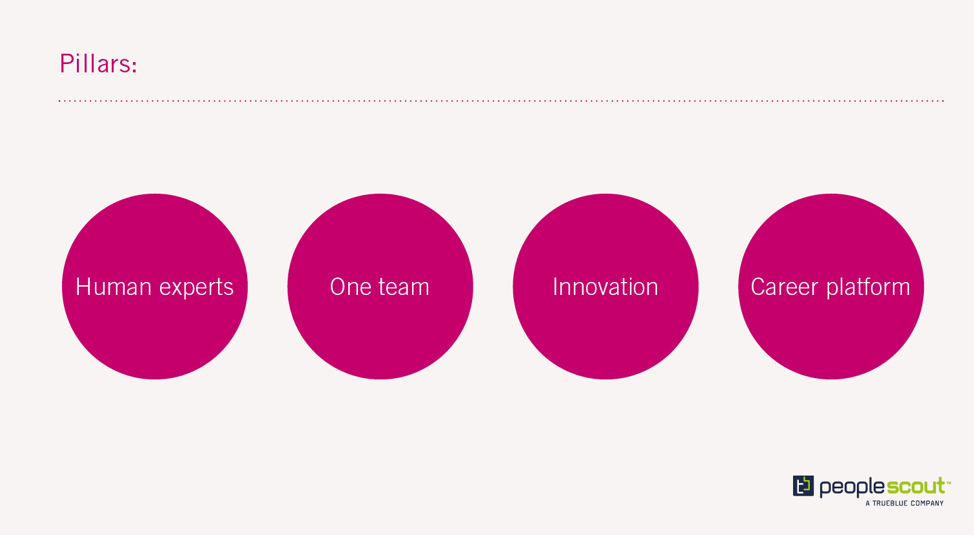
  • Pillars: Pillars are the core components of your EVP and are informed by insights into your cultural DNA and your audience’s motivations. Pillars are used to define the relevance of your EVP and are based on research.
  • Narrative: The narrative is usually a single, manifesto-style paragraph – it’s the emotive “sell” of what you offer. The narrative defines consistency throughout your EVP and employer brand strategies.
  • Strapline: Finally, the strapline is a concise phrase that summarizes your overall offering – it focuses on being memorable rather than detailed. The strapline defines a point of focus throughout your EVP materials.

By creating pillars, a narrative and a strapline to support your EVP and employer brand strategy, employers will be set up for a successful deployment both internally to current employees and externally to candidates and the broader marketplace.

For example, we recently completed an EVP and employer brand project for a global law firm based in the UK called Linklaters. Here are the pillars, narrative and strapline that we created to bring the project to life.

Linklaters employment brand pillars
Linklaters employer brand narrative
Linklaters employer brand strapline

Benefits of a Well-Managed Employer Value Proposition and Employer Brand Platform

Organizations that effectively deliver on their EVP can enjoy a host of benefits, including decreased annual employee turnover and increased new hire commitment, according to Gartner research. Other benefits include improved brand sentiment, increased reach to target audiences, a greater sense of commitment from current employees and cost savings related to compensation.

Improved Brand Sentiment

Organizations with effective EVPs are more attractive to candidates and are considered employers of choice – organizations where candidates want to work. In order to make yourself an employer of choice, you have to be able to appeal to your ideal candidates by differentiating your company from your competitors.

A compelling EVP and employer brand can move your brand sentiment in a positive direction. A clearly defined EVP creates the foundation on which to build your internal and external employer brand messaging, which allows you to have greater influence over what you are known for and how you are perceived.

Increased Reach

A thoroughly researched and tested EVP is designed to speak more effectively to your target talent audiences. When you are able to tailor the core of your message to individual audiences, while keeping your narrative and strapline consistent throughout, more diverse groups of candidates will respond favorably. This has real business impact. According to a Morgan Stanley study in The Atlantic, there is a positive relationship between equity returns and the gender composition of an organization’s employee base, as an example.

We work with an organization in the UK that was once an online automobile magazine but is now a digital publication. The organization struggled with brand perception. Many candidates thought the company was old-fashioned, and they struggled to attract women to their open positions. We developed an “adventures in awesomeness” EVP that spoke to the digital transformation that had already happened at the employer. This EVP not only increased brand attractiveness and shifted sentiment, but also increased the number of women visiting the careers site by 300 percent.

Greater Employee Commitment

Organizations with strong EVPs enjoy significantly higher levels of engagement from employees. In one example studied by Cornell University, a beverage bottling and distribution company launched an initiative to develop an integrated employer brand. Around the same time, the company decreased headcount by more than 6 percent and maintained tight control over salary raises. Despite these difficulties, employee engagement grew at the company from 36 percent to 55 percent over a five-year period.

This study suggests that when you clearly articulate your EVP and the behaviors you’re looking for from employees, it can be a factor in successfully attracting and retaining employees with the right cultural fit for your organization. This yields more engaged employees.

Compensation Savings

Organizations with effective EVPs are able to reduce the compensation premium required to attract new candidates. Another example highlighted in the Cornell paper found that organizations with a well-managed employer brand had a 26 percent economic advantage in terms of labor cost.

Key Considerations When Creating an EVP and Employer Brand Program

There is ample data that shows that effective EVPs generate real business benefits. To realize those benefits, there is a lot of work that goes into creating a successful EVP and employer brand. Before launching an EVP internally or externally, it’s critical that companies spend time researching, defining, developing, optimizing and deploying an EVP that accurately represents the company’s value to employees.

Recruitment for Retention

“Where do you see yourself in five years?” It is perhaps the most time-worn question in a job interview. But if the candidate answers that if they are hired, they will be happily working in your organization, the odds are against this ever happening. Why? The average time workers in the U.S. remain in one job is just 4.2 years. And in other leading economies, the average single job tenure can be similarly brief. In the UK, workers change jobs every five years, while in Australia, the national average job tenure is just three years and four months. In Canada, the average length is 8.5 years, but the averages vary widely depending on the industry.

For those hoping to attract and retain top talent, these figures can be familiar – and a cause for concern. When human resource professionals look inside their organizations and identify employees who have defied the statistical average, staying with the company far longer than five years and contributing significantly to its success, they wonder “how do I get more of them?” With low unemployment making many job markets the most challenging in recent memory, there is genuine urgency not only to retain the best talent but to find a way to attract talent that will stay with an organization for the long-term. In other words, there is a need to recruit to retain, but how?

Know Your Talent: Why They Leave and Why They Stay and Thrive

Like many organizations, your company may already have an employee retention program in place. Enterprises are making considerable efforts to retain talent, and the processes they deploy to improve employee retention can also be incorporated into your recruitment process.

For example, it is relatively common to have exit interviews with departing workers to better understand why they are leaving the organization. When a sufficient number of exit interview results are available and evaluated, trends can emerge that can lead to actionable items to improve employee retention. Certain common traits or characteristics may also appear among those who voluntarily leave their jobs.

Less common, but potentially just as valuable, is the “stay interview.” These interviews with current employees allow them to express their concerns before they are in a position to leave, which can help leaders address issues and take steps to retain top talent.

And just as exit interviews can bring into focus the characteristics of those who quit, the stay interview can help identify the traits of those who remain and thrive. Once a group of long-term successful employees is identified, a stay interview can be designed for this group with the goal of identifying why they have remained with the company, what factors have contributed to their success and what characteristics many or most of them have in common. Identifying these characteristics in your candidate pool during the recruiting process could be an indicator of future success.

In today’s tight job market, if you are not working to identify candidates with the characteristics that have been proven to lead to long-term achievement in your company, your competitors probably are. SHRMreports that “Many organizations are seeking more of a ‘whole person’ gauge of candidates, experts say, assessing not just skills or intellectual horsepower but also personality traits, cultural fit and motivational drivers that can prove the difference between candidates who thrive over the long run and those who quickly derail.”

Predictive Analytics: Unlocking the Key to Recruitment for Retention

Predictive analytics is a type of data analytics that uses data to find patterns and then uses those models to attempt to predict the future. Consider the most basic data you likely have about a single employee who worked for your organization and left after five years. A sample of data points could include:

  • How they were sourced
  • Their addresses over their tenure at the company
  • Their education and certifications
  • Previous employers

These data points alone may not provide insight into why this employee joined your organization and why they left. But, if just these pieces of information were aggregated for all your employees, both past and present, here are a few insights which could be determined:

  • Is there a correlation between how an employee is sourced and their tenure at the organization?
  • Do employees who live far from the workplace quit sooner than those who do not?
  • Do employees from certain schools or that have particular certifications stay longer with the company than others?
  • Are there previous employers which produce more long-term employees than others?

The information found in even one of these examples could be built into your recruitment strategy and have a meaningful impact in recruiting talent that will remain with your organization.

The right technology using predictive analytics can provide effective recruiting insight, as PeopleScout’s Allison Brigden explains:

“In this tightening talent market with unemployment rates at record lows, predictive analytics is emerging as an essential AI tool for employers looking to stay ahead of the competition. Predictive analytics allows employers to use the power of data to make predictions about candidates and drive efficiencies throughout the entire talent acquisition process…

Predictive analytics can’t tell you what will happen, but it shows what is likely to happen based on past trends. It’s as close as employers can get to predicting the future.”

Solving for Retention

The dilemma faced by a major auto retailer was challenging but not surprising. The annual turnover rate in the retail sector is much higher than the national average in the U.S. With a 50% turnover rate and a need for 10,000 annual hires, there was an immediate need for drastic improvement

PeopleScout partnered with this automotive retailer and was able to rapidly address their turnover challenges by implementing the following solutions:

A Standard Hiring Model

An uneven hiring process was replaced, and a standard hiring model was put in place that included consistent OFCCP compliance and standardization across the company.

An Efficient Process

PeopleScout deployed a time-efficient screening process which focused on the quality of the candidate, with a guaranteed response from recruiting teams within 48 hours of application. To quickly present candidates to hiring managers, PeopleScout implemented block interview scheduling with great success.

Hiring Diversity

To help source and engage more diverse candidates, PeopleScout developed a comprehensive network of community organizations for partnered recruitment.

In-Region Recruiters

Collaborative relationships between recruiters and the client’s area managers were fostered by in-region placement of PeopleScout recruiters.

Transparent Reporting

Continuous improvement was driven through transparent reporting and analysis for the client’s executive and field leadership.

The Results:
  • PeopleScout hired 10,000 employees in the first year of the engagement.
  • The technician turnover rate improved by 5% and retail turnover by 6%.
  • Hiring diversity improved by 40%, including an increase of 2% for veterans and 6% for female hires.

PeopleScout Canada Jobs Report Analysis — February 2019

Statistics Canada reported that the nation’s unemployment remained at 5.8% due to more people entering the job market while wage growth continued to be sluggish. Canada added 56,000 jobs in February. Weekly annual wage increases were up 2.0% and hourly wages increased by 2.3%, up from just 2% in January.

Canada Jobs Report Analysis — February 2019

The Numbers

56,000: The economy gained 56,000 jobs in February.

5.8%: The unemployment rate remained at 5.8%.

2.0%: Weekly wages increased 2.0% over the last year.

The Good

The strong February figures follow an even bigger gain of 66,800 jobs in January. This is the best two-month increase in the job market since 2012. The unemployment rate was unchanged is because more Canadians joined the labour force. In the past 12 months, total employment grew by 369,000 or 2.0%, reflecting increases in both full-time (+266,000) and part-time (+103,000) work.

While the gains are still modest, wage growth began to pick up in February. Annual hourly and weekly wages increased by 0.5 percentage points over January. Economists welcomed the positive wage growth and the resilient job market which appeared to shrug off signals for concern in other parts of the economy:

“The weak economic data that closed out 2018 and soft momentum heading into this year has not yet had any impact on the jobs numbers,” Toronto-Dominion Bank economist Brian DePratto said. ” Labour markets didn’t get the memo.”

Ontario was the big winner again in February with an increase of 59,000 full-time positions. On a year-over-year basis, employment in the province increased by 2.7% or 192,000.

The Bad

The good news for Ontario in February was the exception since the job numbers for most of the rest of Canada remained flat or showed modest fluctuations. In Alberta, where the economy is heavily influenced by the energy sector, the unemployment rate increased. The CBC reported that the rate increase was spurred by an increase of those looking for work.

“Alberta’s employment level was mostly unchanged from January and last February, but the agency says the number of people looking for work has increased, pushing the provincial unemployment rate up to 7.3%. Calgary’s unemployment rate for February is even worse at 7.6%, up 0.3% from January. Edmonton’s unemployment rate also rose to 7.0% from 6.4% in January.”

The contrast to Ontario’s unemployment rate of 5.7% is not limited to Alberta. Prince Edward Island’s unemployment rate stands at 10.3% and New Brunswick’s at 8.5%. These maritime provinces have struggled with high unemployment in recent years contributing to a lop-sided jobs market which favors the richer and more populous provinces.

The Unknown

The Globe and Mail notes that one constant in the monthly jobs report numbers is that they appear to consistently defy analyst expectation.

“What’s an easy way to trip up an economist? Ask one to forecast Canadian job growth…Derek Holt, head of capital markets economics at Bank of Nova Scotia, pointed out the chronic shortfall in estimates after January’s report. Since the end of 2015, the economy had added nearly 900,000 jobs, as measured by the net change in employed persons. Economists called for 325,000 positions, or less than 40% of the total, based on the monthly consensus forecast of those surveyed by Bloomberg….

Economists have long struggled to pin down job gains. To some degree, that’s defensible. The LFS is often derided as a ‘random number generator,’ largely because the monthly change in employment comes with a hefty margin of error, typically around 29,500. For some perspective, since 2000 the Canadian economy has added an average of 18,600 jobs per month, or substantially lower than the margin of error.

Put another way, we typically don’t know whether Canada truly added or lost jobs from one month to the next. December provides a good example. The LFS said a net 8,700 jobs were created that month. But here’s another way of describing what happened: the true figure may have fallen between a gain of 37,200 jobs and a loss of 21,600 positions, after taking into account the margin of error. Even then, there’s a chance the true figure fell outside that range.

For economists, their forecasts have hit a particularly rough patch. Consider that from 2000 through 2015, the consensus amounted to 58% of the total number of jobs created during that period, versus 37% since then.

So, what’s going on? Douglas Porter, chief economist at BMO Nesbitt Burns, points to population gains. In a February research note, he noted that Canada’s population aged 15-plus increased by 432,100 in January from a year earlier, the largest 12-month increase in 43 years of records…

There’s also another factor at play: job growth, per the LFS, might simply be playing catch-up. Statscan has multiple measures of employment, including the payroll survey of employers, which many economists consider a more reliable gauge of job growth. Since the end of 2015, cumulative job growth was fairly similar between the surveys, before the LFS started to lag in 2018. January’s outsize gain went a long way to narrowing the gap.”

PeopleScout U.S. Jobs Report Analysis — February 2019

The Labor Department released its February jobs report which shows that U.S. employers added 20,000 jobs in February, well below analyst expectations. The unemployment rate decreased to 3.8% last month. Year-over-year wage growth increased to 3.4%, the best rate in a decade. U.S. employers have added to payrolls for 101 straight months, extending the longest continuous jobs expansion on record.

U.S. Jobs Report Analysis — February 2019

The Numbers

20,000: The economy added 20,000 jobs in February.

3.8%: The unemployment decreased to 3.8%.

3.4%: Wages increased to a rate of 3.4% growth over the last year.

The Good

Despite the low number of new payrolls added, the historic job creation streak continued. The change in total nonfarm payroll employment for December was revised up to +227,000, and the change for January was revised up to +311,000. After revisions, job gains have averaged 186,000 per month over the last three months.

The unemployment rate declined by 0.2 percentage points to 3.8% in February, and the number of unemployed persons decreased by 300,000 to 6.2 million. Among the unemployed, the number of job losers and those who completed temporary jobs (including people on temporary layoff) declined by 225,000.

This decline reflects, at least in part, in part, the return of federal workers who were furloughed in January due to the partial government shutdown. Those workers who were working part-time jobs for economic reasons are now in full-time positions. As one economist put it, “They now have paychecks and don’t need to drive Uber to make ends meet.”

A comprehensive unemployment rate that counts discouraged workers as well as those holding jobs part time for economic reasons, which is often called the “real” unemployment rate, fell to 7.3% in February from 8.1% in January.

The year-over-year wage increase of 3.4% is well above the rate of inflation. The result will likely result in more consumer spending that helps fuel the American economy.

The Bad

February’s report shows the weakest job growth since September 2017. While there are one-time factors such as the partial government shutdown and record cold temperatures in much of the country which may have contributed to the modest growth, it could also be an indicator of a slowdown in the job market in the coming months, the New York Times reports.

“With a single report, the six-month average rate of job growth has fallen to 190,000 from 234,000. That lower number is a better fit with everything else we know about the state of the economy — particularly a 3.8% unemployment rate and lots of anecdotal reports of scarce workers. Businesses can’t add people to the payrolls who don’t exist. Add in the ample evidence that the overall rate of growth is shifting down as trade wars continue to disrupt industries and as the impact of tax cuts fade, and a more modest rate of job creation makes sense. So job growth in the sub-200,000-a-month range seems a lot more plausible for the rest of 2019 — and yet more deceleration is a strong possibility.”

The Unknown

How significant is February’s weak jobs report? Many analysts caution that one report does not provide a clear indicator of long-term trends:

“Mark Hamrick, senior economic analyst at Bankrate.com, said “slowing job growth is to be expected over the coming year, one way or the other,” but blamed much of the February shortfall on a seasonal hiring slowdown in the construction and leisure and hospitality sectors. “It is fodder for a reminder that we cannot assume too much about a single monthly report.”

While the economic significance of the February report remains to be seen, some analysts argue that the overall fundamentals of the American economy remain strong and therefore this weak jobs report could essentially be an outlier:

“One month does not a trend make, and the United States economy remains very robust, especially when compared with sluggish Europe and slowing China. Oil prices are falling, which helps all sectors of the economy except, of course, oil. And while the trade deficit reached a record in 2018, that is a sign of strength not weakness.  Exports rose sharply, but imports rose even more, thanks to the booming American economy. And, by definition, capital inflows must offset trade deficits, so a lot of foreigners think the United States is a great place to invest.”

Having been surprised by the details of February’s report, those with a stake in the U.S. and world economy may be anticipating the results of next month’s report with an eagerness they have not felt in years.

What’s NEXT: Prescriptive Analytics

Imagine your day as a lead recruiter for a major retailer. You have delivered successful results, but sometimes you get bogged down with small details. By the end of this month, you need to fill 27 requisitions for store managers and customer service supervisors – a pretty normal workload that you’re used to.

At 8 a.m., you look at a weekly dashboard report sent by your VP that describes how you are performing against monthly recruiting goals. You are doing well, but you have to turn it up a bit more. Ten of your requisitions are new, five are in the interview stage and eight are in the offer stage. You know how to manage this – you are a pro – but there is so much to do.

From 8:21 until 10:59 a.m., you respond to several calls, filter so many resumes you lose track, and perform a couple phone screens; it makes it hard to take a minute and plan with this type of pace.

By 3 p.m., the day has flown by and you now need to spend time reviewing your activity log for the day. In an ideal world, you’d clear your plate of your morning tasks and instead spend time building candidate relationships. However, you remind yourself that this type of pace and workload is true for most recruiters.

At 4:30 p.m., you receive some predictions from your finance team of where you need to shift your focus. This will help you manage your time better, but to be honest the data would have been more helpful if you had received it last month. You love reading the color-coded strike zone reports though and take note of how long it is taking to fill some of your harder-to-fill roles.

By 5:30 p.m., you leave feeling like you’ve done your best to tackle the day and made some real progress. You are putting out fires and making everything work, but what would be really helpful would be a prescription telling you what and where to attack each day to help you achieve even better results and be more efficient.

Maybe your prescription could look something like the following:

Prescriptive Analytics

Prescriptive Analytics is Next

In our story, the recruiter received several different types of information, but the amount of disparate data was still unhelpful in the recruiter’s daily work. What our recruiter needed was some form of prescriptive analytics metrics to figure out where to focus their time.

What does prescriptive mean in the context of analytics? Prescriptive analytics solutions make predictions and answer questions related to “what to do” and why some action will take place. Prescriptive analytic output also delivers results from different options to help support various decision paths.

Prescriptive analytics solutions are only beginning to enter the mainstream world of talent acquisition. Rob Wells, managing director of Workday in Australia and New Zealand said, “The most innovative companies are relying on analytics in their HR programs and those that are implementing prescriptive analytics will reap the biggest rewards.” Gartner predicts that the prescriptive analytics software market will reach $1.1 billion by 2019. InformationWeek lists resource optimization, broadly termed as matching resources such as people and goods with an organization’s needs (e.g. talent acquisition), as a strong target for growth.

Prescriptive analytics is more easily understood in context with its relationship to descriptive and predictive analytics.

Predictive vs. Prescriptive Analytics

While predictive and prescriptive analytics sound alike, prescriptive analytics is the more advanced solution of the two. Prescriptive analytics builds on predictive analytics forecasts and transitional analytics solutions such as diagnostic analytics to evolve toward overall better decisions.

Predictive analytics today is more widely deployed. Predictive analytics uses data to find patterns and then uses that information to make forecasts that can shorten the recruiting process and produce stronger hires. While predictive solutions produce forecasts based on existing data, prescriptive solutions answer problems. As Gartner states, companies should ask “What can we do to make ____ happen” – prescriptive analytics helps answer that question.

Talent Analytics Adoption: Most, Some, Few

Descriptive Analytics

Receiving detailed data on past behavior equates to descriptive analytics. Most companies have this today.

Most organizations, up to 90 percent, are using some type of basic analytics function such as descriptive analytics. This is a common activity in talent acquisition as well. Descriptive analytics activities in talent acquisition looks at activity related to candidate generation, like the volume of candidates, time-to-close, cost of the candidate search and source-of-hire.

Predictive Analytics

Reviewing predictions of what might happen is predictive analytics. Some companies have this today.

Giant retailers such as Amazon are known for their predictive analytics solutions that manage data, inventory and customer needs. Some recruiters in talent acquisition have also begun to use predictive analytics tools. Predictive analytics throughout the sourcing process is also integrated into PeopleScout’s proprietary talent technology, Affinix.

Prescriptive Analytics

Knowing where to act and how to move in a specific way is prescriptive analytics. Few companies have this today.

The healthcare industry has seen success using prescriptive analytics. One company implemented a prescriptive analytics solution that analyzed the number of obese patients and then added cholesterol and diabetes risk levels to customize specific treatments. A few early possibilities are evolving for prescriptive analytics in talent acquisition. Prescriptive analytics could help predict learning paths for employees, helping to extend their tenure at an organization. Recruiters can also anticipate when candidates might ghost an opportunity – known as a candidate’s joining probability – and get a prescribed solution to fix the situation.

Challenges

As prescriptive analytics models enter the talent acquisition world, what are some implementation challenges to keep in mind?

  • Price. Right now solutions are targeted and priced more for larger organizations.
  • Talent. Many in-house analytics teams may not have enough people with the right skills to implement a prescriptive analytics solution. In fact many organizations are still struggling with adopting predictive.
  • Buy-In. Organizational buy-in to implement a solution like prescriptive analytics is critical. Many organizations are still in the consideration stage for predictive analytics as mentioned and are not ready for prescriptive analytics offerings.

Preparing Your Prescription

How should you prepare for the use of prescriptive analytics? Regardless of your organization’s readiness for prescriptive analytics, you should keep the following planning tips in mind:

  • Review your current analytics capabilities. Where is your organization in its analytics “journey?” Are you delivering complex or more simple descriptive analytics functions today?
  • Evolve your analytics business case. What problems can you solve today, what would you like to solve in the future? What tools will help you meet different challenges?
  • Assess potential vendors. Some vendors may say they are selling prescriptive analytics solutions but are not. Terminology across AI, machine learning and different analytics terms is sometimes misused. Do your due diligence to find out if your vendor can deliver the results you need.

Key Takeaways

  • Prescriptive analytics is the most advanced stage of business analytics currently available after descriptive and predictive analytics solutions.
  • While prescriptive analytics may not be used widely in talent acquisition, the potential for this next-generation analytics offering is promising.
  • To prepare for prescriptive analytics implementation, assess your company’s existing analytics challenges and determine if prospective vendors are prepared to help you with the analytics problems you want to solve.

PeopleScout Australia Jobs Report Analysis – January 2019

The 39,100 jobs added in January beat analyst expectations while the unemployment rate remained steady at 5.0% as more Australians joined the workforce. The job growth was entirely due to full-time employment. Wage growth continues to be slower than many would hope for in the current tight job market.

Australia Jobs Report Analysis - January 2019

Numbers

39,100: The Australian economy added 39,100 jobs in January.
5.0%: The Australian unemployment remained at 5.0%.
65.7%: Labour force participation rose to 65.7%.
+4: The Business Confident Index rose to +4 in the latest NAB release.

Upside

The Australian Bureau of Statistics (ABS) announced that employment rose by 39,100 in seasonally adjusted terms, surpassing forecasts for a smaller increase of only 15,000. The job increase was entirely attributable to full-time positions. New South Wales was the clear winner in the nation’s job market adding 47,200 jobs. The unemployment rate in New South Wales plunged to 3.9%. Since January 2018, full-time employment increased by 236,100, while part-time employment increased by 35,200. The unemployment rate remained unchanged because more Australians were attracted into the nation’s workforce.

The report also showed that the number of women in Australia’s workforce is at a record high and that the pay gap between men and women has fallen to a 20-year low.

Downside

The job gains in New South Wales were offset by more modest increases and losses in other states. Victoria had an increase of just 2,200 and Western Australia of only 800. The largest decrease was in Queensland which was down by 19,900 followed by South Australia with a decrease of 4,500.

The disparity in the employment situation among Australian states may indicate that “full employment” has not yet been truly achieved on a national level, as Business Insider Australia reports:

“While full employment may have been reached in New South Wales and Victoria, at 5 per cent, Ben Udy at Capital Economics says today’s data suggests full employment still has yet to be reached nationally.

‘We suspect that the natural rate of unemployment has declined in recent years and actually sits closer to 4.0 per cent,’ he says. ‘That would mean that the current unemployment rate of 5.0 per cent is still well above the natural rate.’

Given a plethora of downside risks facing the Australian economy this year, Udy is doubtful whether there’ll be any acceleration in wage growth this year.

‘Our view is that the housing downturn and weakness in the wider economy will mean that the unemployment rate may rise this year. If we’re right, it’s hard to see wage growth picking up pace anytime soon,’ he says.”

Unknown

Adding to the focus on the geographic disparities in Australia’s economy, a new study reported by the Sydney Morning Herald highlights the challenges for some of Australia’s young workers, with potential implications for the nation’s economic future. The article states:

“Up to one-third of all young people in some of the nation’s most marginal electorates are without a job or underemployed…with warnings many have skills that will be useless within a decade.

Compiled by the Foundation for Young Australians, the report points to parts of Queensland and Western Australia most at risk from a chronic mismatch between the jobs needs of young people and the skills they will take into the workforce.

It argues the economy is being short-changed $4.5 billion a year because so many young people are either outside the workforce or failing to get enough hours of employment every week.

Foundation chief executive Jan Owen said the mismatch between what young people learn and what they will need in future is one of the nation’s most pressing economic challenges.

‘To get to where we need by 2030, and avoid the economic and social crisis that is looming, we need a strong framework that delivers systemic change and that is based on evidence,’ she said. ‘Without an integrated approach we are likely to end up with even greater problems, with employers, education and training providers, workers and the national economy all losers.’”