PeopleScout Canada Jobs Report Analysis – August 2019

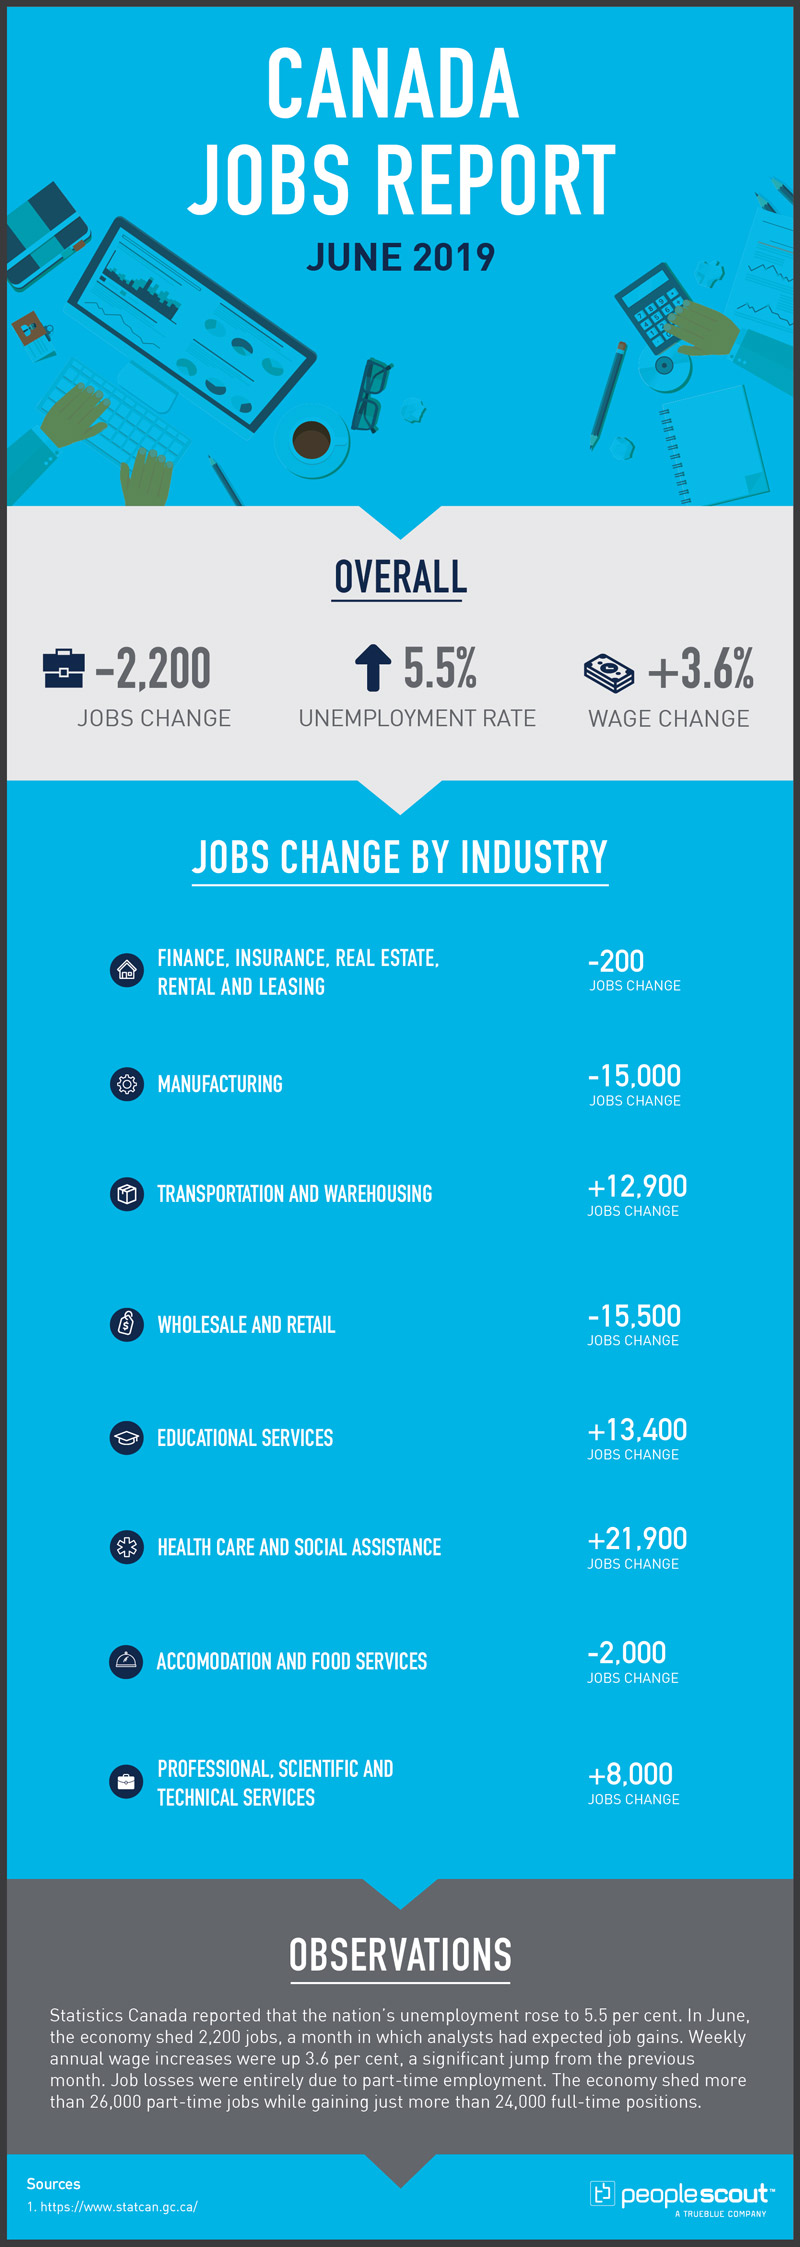
Statistics Canada surveyed that the nation’s unemployment remained at 5.7%. In August, 81,000 jobs were created. Weekly annual wage increases were up 3.6%, a full percentage point lower than the previous month. Much of the increase in August was in part-time work.

canada jobs report infographic

The Numbers

+81,000: The Canadian economy added 81,000 jobs in August.

5.7%: The unemployment rate remained steady at 5.7%.

3.6%: Weekly wages increased by 3.6% over the past year.

The Good

The headline number in the August jobs report is good news for the Canadian economy. The 81,000 jobs added quadrupled the 20,000 job increase that analysts expected, according to Bloomberg. The increase is more than five times larger than Reuters economists expected, at just 15,000. Over the past year, Canada has added 471,300 jobs, the highest number since 2003. With this increase, the unemployment rate remained at 5.7%, which is near a historic low.

Ontario saw the biggest increase in jobs with 58,000 new positions, while Quebec, Manitoba, Saskatchewan and New Brunswick also gained jobs. Unemployment stayed steady for most of the country, but British Columbia and Nova Scotia saw an increase in their unemployment rates as more people started looking for work, CBC reports.

The Bad

While the 81,000 number looks great, the majority of the positions created are part-time jobs. The Global News reports that 57,200 of the newly created jobs are part-time Additionally, 42,000 of the positions are held by workers under 24-years-old. However, the majority of the jobs created over the past year have been full-time positions.

The Unknown

For those with questions about whether the Bank of Canada would consider a rate cut, the latest report indicates that is unlikely, Reuters reports.

However, according to The Wall Street Journal, some experts say the looming global downturn could start to have more of an effect on the Canadian economy.

“’We expect the global slowdown to take a more material bite’ by the fourth quarter, CIBC World Markets economist Avery Shenfeld said. He said that could prompt the Bank of Canada to lower interest rates in late December or early next year.”

PeopleScout U.S. Jobs Report Analysis – August 2019

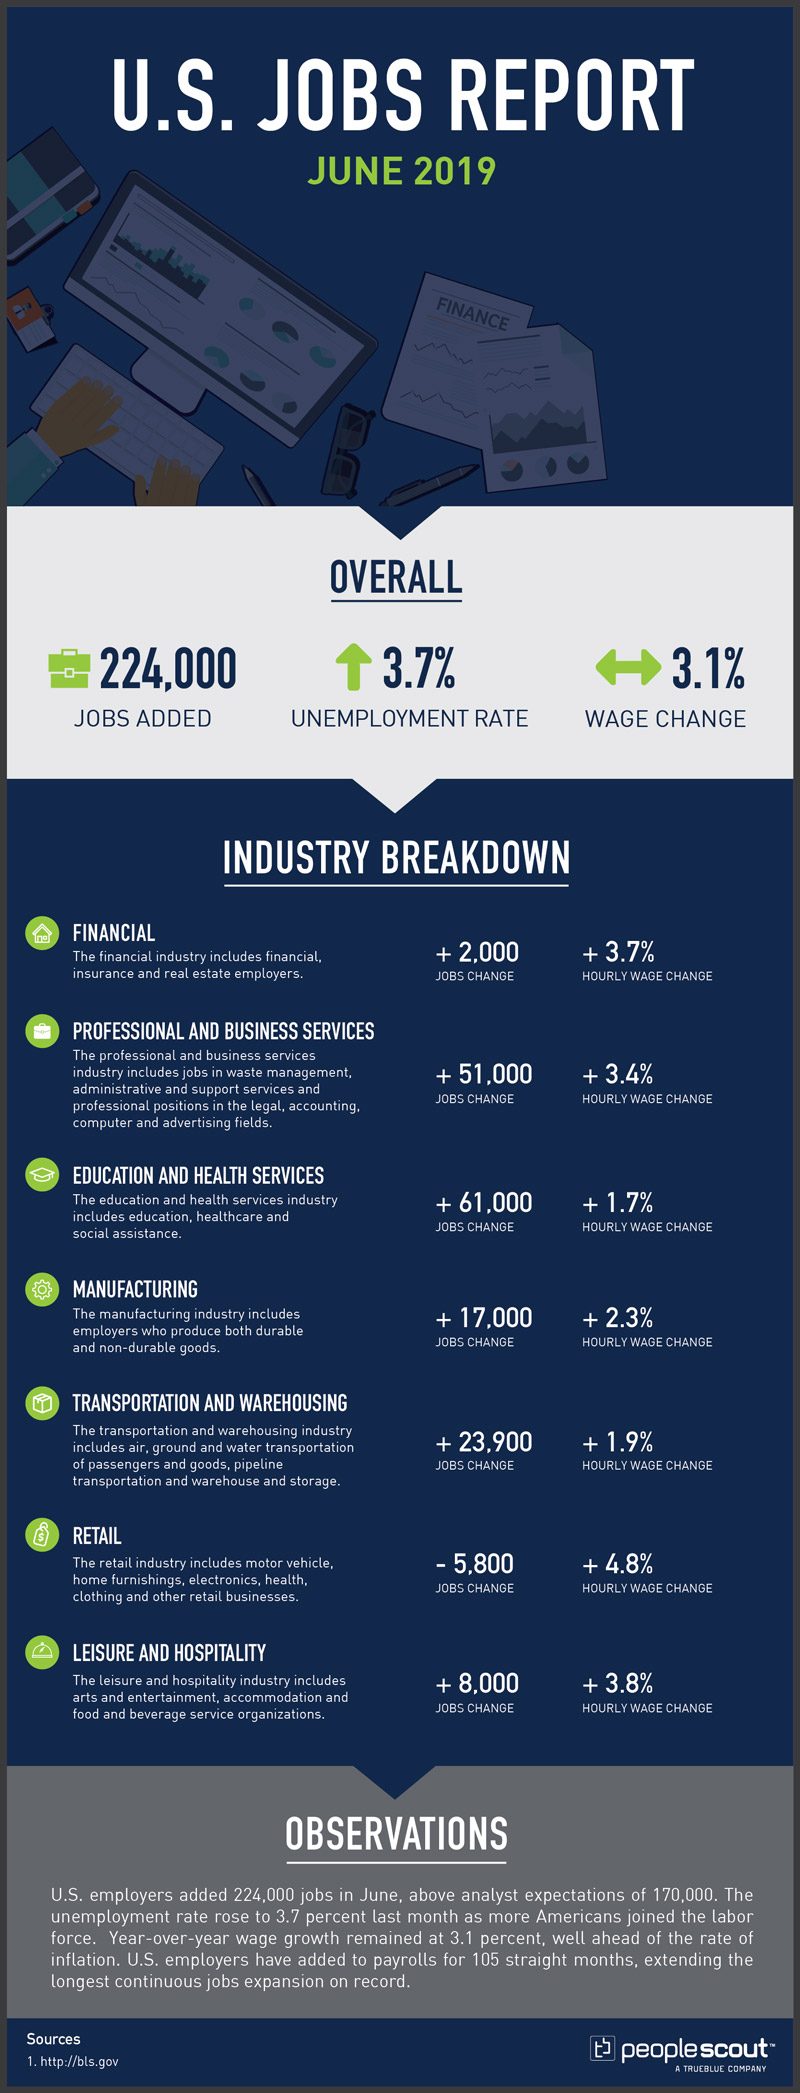
The Labor Department released its August jobs report which shows that U.S. employers added 130,000 jobs, lower than the 165,000 analysts expected. The unemployment rate remained at 3.7% — a near 50 year low. Year-over-year wage growth remained at 3.2%, well ahead of inflation.

us jobs report infographic

The Numbers

130,000: The economy added 130,000 jobs in August

3.7%: The unemployment rate remained steady at 3.7%.

3.2%: Wages increased by 3.2% over the past year.

The Good

According to economists, August’s jobs report numbers are decent but not great. The New York Times reports that one of the highlights of the report is the increase in labor market participation, which grew from 63% to 63.2%. This indicates that the economy is strong enough to draw in people who have been sidelined. The number is even more positive among workers between 25- and 54-years old, the prime working ages. In that group, the percentage of people working or looking for work increased from 82% to 82.6%.

The Bad

While many of the details of the latest report are not necessarily bad, they’re not necessarily good either. The job gains fell short of analyst expectations, and according to the Wall Street Journal, 25,000 of the jobs created in August are temporary positions for the 2020 census. Private-sector employers added just 96,000 jobs. Job growth appears to be slowing.

The New York Times also reports that industries that involve making something – manufacturing, mining and construction – are experiencing the most significant slowdowns, and this could be an indication that the economy is slowing. However, economists say that this report demonstrates that fears of a recession are overblown.

The Unknown

The big question is whether slowing growth is a symptom of a larger problem in the U.S. economy. The New York Times reports that while some sectors of the economy are slowing more than others, industries like business and professional services and healthcare are growing just fine. This suggests that while exceptional job growth isn’t likely to continue forever, the economy is more stable than some have feared.

The Wall Street Journal tells a similar story, with one analyst suggesting that the labor market has peaked, but could stay stead for some time.

“Overall economic growth probably averaged 2% over the last 12 months,” wrote Wall Street Journal Chief Economics Commentator Greg Ip. “Given stable unemployment, that’s probably the U.S. economy’s long-run potential. Something will upset this equilibrium, but it’s hard to say what. For now, fiscal policy, trade war and interest rates seem to be mostly canceling each other out.”

Talking Talent: Field Test: How to Attract Top-Performing Field Talent

Attracting candidates with the right cultural fit is difficult at any organization. The issue is compounded when employees are not working in an office environment but instead out in the field, working face-to-face with your customers. For organizations with field service employees, the workers that spend the least amount of time in your office are often the face of the organization.

So how do you attract and hire the best field service workers? 

Joining us to talk about this is Chris Gera, the Managing Director, Executive Vice President for Service Council™. In his role, Chris is defining and executing the Service Council’s Research & Insights™ product portfolio.

As the Senior Analyst on Service, Chris is directly connected to Senior Service Leaders and Solution Providers to drive the Service Council’s Smarter Services™ agenda. This provides service executives and organizations the ability to benchmark their operations and also provide guided insight to target how to improve their service organization performance and deliver the full potential of their change management initiatives.

Chris also leads new member acquisition, member engagement, community expansion and the development of their annual Symposium. Chris plays a key role in building out Service Council’s community platform which is focused on becoming the single source of information and networking for service and customer support executives globally.

Prior to his role at Service Council, Chris held service leadership positions at Vivint SmartHome, where he managed 1,200+ field professionals supporting more than one million customers across North America. While at Nielsen, he led global strategic field initiatives, specifically digitization and technology and process improvement implementations of a $1B profit and loss service business supporting greater than 15,000 field professionals in over 100 countries around the globe.

Also joining for this episode are Mike Yinger and Janice Weiner. Mike is our global leader of growth and strategy here at PeopleScout, and he is responsible for global sales results and organizational strategy. Janice leads cross-selling and total talent initiatives for PeopleScout. Total talent includes all the ways a company can “get its work done.” Getting the work done from a company’s field service perspective is what we focus on in this episode.

PeopleScout Australia Jobs Report Analysis – July 2019

Australia’s economy added 41,100 jobs in July, beating analyst expectations. The unemployment rate held steady at 5.2% as labour participation increased. The Bureau of Statistics reports that full-time employment increased by approximately 34,500 and part-time employment rose by close to 6,700.

July 2019 (August Report) Unemployment rate – Seasonally Adjusted: 5.2 percent (Sideways Arrow) Jobs Change: +41,100 Labour Force Participation: 66.1 per cent (Up Arrow) Business Confidence Index: +4 (Up Arrow) Sources: http://www.abs.gov.au/ https://business.nab.com.au https://www.businessinsider.com.au/ https:/abc.net.au https://business.nab.com.au/ Summary: Australia’s economy added 41,100 jobs in July, beating analyst expectations. The unemployment rate held steady at 5.2% as labour participation increased. The Bureau of Statistics reports that full-time employment increased by approximately 34,500 and part-time employment rose by close to 6,700.

Numbers

41,100: The Australian economy added 41,100 jobs in July.

5.2%: The Australian unemployment rate remained at 5.2%.

66.1%: Labour force participation rose at 66.1%.

+4: The Business Confidence Index rose to +4 in the latest NAB release.

Upside

After an initial report of only 500 net jobs added in June, the Australian economy gained 41,100 jobs in July, easily beating analyst expectations of 14,000. The unemployment rate did not decrease because the labour force participation rate rose to 66.1%, a record high. At this peak level of participation, approximately two out of every three Australians of working age are either currently employed or looking for work. The number of those employed in Australia has grown by 2.6% over the last year.

The states with the largest employment increases in July were Queensland with 19,900, New South Wales with 13,000 and Victoria with 3,600.

Downside

Despite the impressive job growth in July, unemployment rolls grew by 800. There was a reversal of fortune for Western Australia. In June, every state except Western Australia posted job losses. But in July, it had the nation’s largest number of jobs lost, decreasing by 4,200. The wage figures released this week showed continued stagnation with an annual rate growth of just 2.3% in the second quarter. This rate has not changed since the third quarter of 2018. It is thought that anemic wage growth was an important factor in RBA’s recent interest rate cut to a record low of 1%.

This deadlock in wages is generating speculation that additional interest rate cuts may be necessary since market forces alone are not boosting economic conditions:

“The data largely confirms the RBA’s view that spare capacity is limiting upward pressure on wages, and the economy needs to generate more jobs to absorb the extra workers,” said Sarah Hunter, chief economist at BIX Oxford Economics. “Given this, we still expect the Board to cut the cash rate again this year, to 0.75% and possibly one more time in early 2020.”

While some analysts do not predict robust action by the RBA, they caution that weaker job growth and higher unemployment is on the horizon. Marcel Thieliant from Capital Economics expressed doubts that the job growth reported in July can be sustained:

“The strong rise in employment in July suggests the RBA won’t be in a rush to ease policy further, but we think it won’t be long before the unemployment rate starts to rise again,” he wrote.”Employment surveys suggest that jobs growth could slow to around 1% by the end of the year. That’s consistent with our forecast that the unemployment rate will climb to 5.5% by the middle of next year.”

The Future of Jobs in Australia

The latest figures from the Department of Employment predicts the employment outlooks for job titles for the five years spanning May 2018 to May 2023. Some of the notable forecasts include:

  • Overall employment is predicted to grow by 7% or 886,100 jobs with a significant number of these likely to be part-time.
  • Intelligence and policy analyst jobs will increase by more than a third to 40,200 in the five years from May 2018 to May 2023.
  • The number of secretaries during the same period will decline by 13,600, or almost one third of the current number.
  • The steepest growth will be in the relatively low-paid aged and disabled care sector with their workforce expected to rise to 245,000 by 2023, an increase of 39%. This strong growth is being driven by Australia’s aging population.
  • The Department of Employment predicts a need for 11,300 extra psychologists by 2023.

The sectors which will experience the greatest growth are healthcare and social assistance; construction; education and training and professional, scientific and technical services. In fact, the Department of Employment predicts that two out of every three new jobs created will be generated by these sectors. 

The reasons given for growth in these areas are:

  • An ageing population, the NDIS (Australia’s National Disability Insurance Scheme) and growing demand for childcare and home-care based services are driving jobs growth.
  • Investment in infrastructure (like roads, railways and airports) means jobs will continue to grow in the engineering construction sector. Workers will also be needed to build homes for our growing population.
  • The number of school-aged children is growing, and there is strong demand for adult and community education. More people are working part-time and in non-teaching support roles.
  • Demand is growing for qualified workers, especially in computer system design and the management and consulting services sectors.

Those hoping to work in the jobs being created over the next few years should take the steps to acquire the necessary skills to succeed in them, and those planning to employ them should consider designing their recruitment strategies with a focus on the institutions providing them with the education and certifications to make them employable. Despite some strong growth in jobs that require little or no formal training, the Department of Employment predicts that over 90% of new jobs created will need “education beyond school and some jobs will need more training than they used to. Many professional and service roles demand university or VET (Vocational Education and Training) qualifications.”

PeopleScout UK Jobs Report Analysis – August 2019

The August Labour Market Report released by the Office for National Statistics includes the quarter covering April 2019 through June 2019. In the quarter, 115,000 jobs were created. Nominal annual regular wage increases rose to 3.9%, the highest level in 11 years. The unemployment rate rose to 3.9% as more people in the UK joined the labour force.

UK jobs report infographic

Notable figures from the August report include:

  • The UK employment rate was estimated at 76.1%, tying the highest level on record since comparable records began in 1971.
  • Estimates for the second quarter show 32.81 million people aged 16-years and over in employment. This is a record high and 425,000 more than for a year earlier. This annual increase of 425,000 was mainly because of more people working full-time (up 262,000 on the year to reach 24.11 million).
  • Part-time work also showed an increase of 162,000 on the year to reach 8.70 million.
  • For May to July 2019, there were an estimated 820,000 job vacancies in the UK, 20,000 less than a year earlier and 20,000 fewer than for the previous quarter (February to April 2019).

A Strong Report Muted By Dim Forecasts

The 115,000 jobs gained in the quarter were almost twice the number that analysts had predicted. With the October 31 Brexit deadline looming ever closer, much of the vibrant hiring activity is being attributed to employers choosing to hire workers now that can be laid off later instead of making long-term investments in their businesses.

The positive job numbers were clouded by last week’s announcement that the UK economy had shrunk for the first time in almost seven years. The economic contraction was blamed primarily on stockpiling preceding Brexit and a weakening global economic environment.

Recent private-sector surveys have indicated that employers are becoming increasingly cautious in their hiring plans due to the potential of a no-deal Brexit. The Bank of England has also noted this month that while the labour market remains tight, there are signs that growth is slowing. Tej Parikh, chief economist at the Institute of Directors summed up much of the analysis of the report: “The jobs market remains a source of strength for the UK economy, though it may now be reaching its peak.”

Key Signs of Economic Strength

Despite warnings of things to come, there were strong economic indicators in the August report. Among the bright spots were the growth in wages and the drop in economic inactivity. The growth in regular nominal wages grew to 3.9%, three-tenths of a percentage point over the last report. Average annual weekly pay including bonuses increased 3.7%. These are the highest rates posted since 2008. With wage increases strongly outpacing the rate of inflation, UK households can translate these pay increases into greater purchasing and investment.

The economic inactivity rate is the measure of those without a job but who are not classed as unemployed because they have not actively sought work within the last four weeks and/or they are unable to start work within the next two weeks. For people in the UK aged from 16- to 64-years, during the April to June 2019 quarter, the estimated economic inactivity rate was 20.7%, tying a record low. Economic inactivity was just 16.3% for men and a record low of 25.1% for women. These historically low rates indicate that the extended strength of the job market has pulled in those who may have remained economically inactive in the past due to increased confidence of finding work.

Zero Hours Workers, An Untapped Talent Source?

Nearly 1 million people in the UK are now working with zero-hours contracts. The 896,000 who are employed with this type of contracts has increased 15% over the last year. The UK government defines zero-hours contracts as:

“Zero-hours contracts are usually for ‘piece work’ or ‘on-call’ work, for example for interpreters.

This means:

  • they are on call to work when you need them
  • you do not have to give them work
  • they do not have to do work when asked

Zero-hours workers are entitled to statutory annual leave and the National Minimum Wage in the same way as regular workers.

You cannot do anything to stop a zero-hours worker from getting work elsewhere. The law says they can ignore a clause in their contract if it bans them from:

  • looking for work
  • accepting work from another employer”

Those working with zero-hours contracts span the age demographic of the nation’s labour force. The number of zero-hour workers aged 65 or over increased by 30% in the last year, and the proportion of 16- to 24-year-old workers on zero-hours now stands at 8.8%.

While many zero-hours workers may prefer the flexibility that their contracts provide, there are certainly others that would prefer the stability and consistency of pay generated by a full-time job. Given that there are more than 800,000 job vacancies in the UK and that zero-hours workers now represent approximately 1 in 40 of those working in the country, there may be a vast pool of talent which has not yet successfully been tapped. Employers struggling with hiring from this pool should consider engaging a recruitment process outsourcing company which can provide the competitive edge in attracting talent at all levels of engagement in the workforce.

PeopleScout Canada Jobs Report Analysis — July 2019

Statistics Canada reported that the nation’s unemployment rose to 5.7%. In July, the economy shed 24,200 jobs. Weekly annual wage increases were up 4.6%, an increase of an entire percentage point from the previous month. The report showed that between May and July, Canada only added an average of 400 jobs per month.

canada jobs report infographic

The Numbers

-24,200: The economy lost 24,200 jobs in July.

5.7%: The unemployment rate rose to 5.7%.

4.6%: Weekly wages increased  4.6% over the last year.

The Good

Statistics Canada reported that compared with July 2018, employment increased by 353,000 employed Canadians or 1.9%. The annual increase was fueled by gains in full-time work which increased by 326,000 or 2.2%. Annual wage gains jumped to 4.6% at the weekly level from 3.6% in June. Annual hourly wages increased by 4.5%, the highest level since January 2009.

After two months of negligible changes in the labour market in Quebec, employment rose by 17,000 in July, with healthy increases in manufacturing and construction. The unemployment rate was unchanged at 4.9% because more Quebecers entered into the labour force. Year over year, employment in Quebec increased by 96,000 or +2.3%.

For the nation as a whole, construction jobs grew by 25,000 in July. About 9,200 more Canadians were working in public administration than in June, primarily due to increases in Ontario.

The Bad

The Canadian economy shed jobs for the second month in a row. In the May-July quarter,  Canada only added an average of 400 jobs per month. There were job losses in Alberta, Nova Scotia and New Brunswick. After two months of increases, jobs fell in transportation and warehousing by 15,000. The number of private-sector employees decreased by 69,000 in July, primarily from losses in the wholesale and retail trade. 

Some analysts pointed to the weak July job numbers as evidence that the Canadian labour markets is beginning to weaken. Brendon Bernard of Indeed Canada noted:

“While still in decent shape overall, the job market clearly has lost some momentum. It’s discouraging to see employment growth lose steam amid recent signs of turmoil in the global economy.”

The Unknown

There has been a significant shift in the age demographics of the Canadian workforce in recent years.  HRD Canada reports that there are roughly the same number of Canadian workers who are aged 25 to 34  as there are 55 and older. in 1996, older workers made up just 10% of the workforce. But by 2018, this percentage more than doubled to 21%.  

Statistics Canada reports that while the proportion of older workers has increased  throughout the Canadian economy, the shift in the healthcare sector is particularly notable:

“Healthcare and social assistance was the largest industry in Canada in 2016, accounting for 2.3 million or 13%, of all workers. This industry also had one of the most rapid growth rates in the number of workers from 1996 to 2016 (+68%).

Despite the rising demand for health care services, workers who are providing health care to an increasingly older population are themselves aging. For instance, among registered nurses and registered psychiatric nurses—the largest occupation related to health care—about 1 in 5 was aged 55 and older in 2016, compared with less than 1 in 10 in 1996.

In 1996, there were 4.5 female nurses aged 25 to 34 for each female nurse aged 55 and older. By 2016, that ratio had declined to 1.6.

Similarly, specialist physicians had one of the largest shares of older workers at 31% in 2016, compared with 23% in 1996.”

While Canadian employers may have to plan for more than 20% of their workforce reaching retirement age in the next ten years, they will most likely avoid the challenge of workers retiring early. Benefits Canada reports that an increasing number of Canadians aged 60 and over are staying in the workforce with 90% of those in this age group working in some capacity.

Canadian employers face the challenge of leveraging the experience and skills of their older workers while putting effective succession plans in place to prepare for the high levels of retirement to come. An important part of succession planning is a recruitment strategy that onboards new talent in time to receive training and mentorship from older workers who have contributed to the success of an enterprise. The expertise provided by a recruitment process outsourcing company can help organizations institute talent acquisition programs that take succession planning into account while providing solutions for immediate hiring needs.

PeopleScout New Zealand Jobs Report Analysis — June Quarter 2019

Stats NZ released the June Quarter Labour Market Report which reported that unemployment fell to 3.9% in the second quarter, down from 4.2% in the last quarter. The last time the unemployment rate was this low was mid-2008. 

nz jobs report infographic

The Numbers

+21,000:  The economy gained 21,000 jobs in the second quarter of 2019.

3.9%: The unemployment rate fell to 3.9%.

2.1%: Overall wages increased  2.1% over the last year.

The Good

After posting job losses in Q1, 21,000 jobs were created in the second quarter. The sectors which had the greatest job gains in the quarter were retail trade, accommodation and food services with an additional 10,100 positions and education and training with 9,300 new jobs. Compared to a year earlier, 45,000 more people are now working in New Zealand. 

Overall wages grew by 2.1% over last year, one tenth of one per cent over the annual increase posted in the first quarter. The seasonally adjusted underutilisation rate fell to 11.0% this quarter, down from 11.3% in March 2019. This is the lowest rate of underutilisation since the September 2008 quarter, when the underutilisation rate was just 10.5%.  

The Bad

The slight lift in the June quarter’s wage increase is being attributed to the new minimum wage law which took effect on April 1. While there was job growth in most sectors, manufacturing lost 6,700 positions. Analysts note that while the labour market is strengthening, indicators point to slowing growth in the future:

“ASB chief economist Nick Tuffley said the labour market had tightened, but he was cautious because all the signs have been pointing to a slower economy.

‘More timely indicators suggest the worm has turned for the labour market. The broader economic slowdown now looks entrenched, and will likely translate into additional labour market slack ahead.’”

State of the New Zealand Workforce

In July, Stats NZ released The Survey of working life 2018, conducted between October and December 2018. Employed people were asked about their work arrangements, employment conditions and satisfaction with their job and work-life balance. The report attempts to create a picture of what working life is like in New Zealand.

The report showed that a majority of New Zealanders are generally satisfied with their work life. But as NZ Business notes, flexibility and work/life balance play an important role in employee contentment, and employers need to be vigilant in these areas or they risk losing talent:

“It’s great to hear that the vast majority of Kiwis are happy with their work lives, showing that employers are definitely getting things right. This is no time for them to sit back though because unless they continue to focus on key areas that make a significant contribution to their people’s satisfaction in their job, they risk losing them.

The Statistics NZ Survey of working life: 2018 of just under 10,000 people showed that 88 percent of people employed – in all sectors and business sizes – were either satisfied or very satisfied with their job. That’s impressive, as is the fact that half of employees had flexible work hours. That links directly with job satisfaction and people feeling like they have a better work/life balance.”

Additional key findings in the report include:

  • Half of employees had flexible work hours, allowing them to start and finish work at different times each day.
  • Almost two out of five employees worked in jobs where their hours of work often changed to suit their employer’s needs.
  • Two-thirds of employed people had worked at a non-standard time at least once in the last four weeks. (Non-standard times includes any hours worked outside of 7 a.m. to 7 p.m., Monday to Friday.)
  • Almost one in 10 employed New Zealanders have more than one job. This equates to 222,900 people.
  • Temporary employees make up 9% of all employees which is 201,300 people, and half of them want a permanent job.
  • A quarter of employed people had been in their job for 10 or more years, and an additional 17% had been in their job for between five and ten years.
  • Six out of ten employees undertook work-related training in the last 12 months.
  • The majority of employed people (57%) felt that the skills they have match well with the skills required for their job.

Are You Getting it Right? How to Manage Your Contract Employee Workforce

Increasingly, organizations are harnessing the talents of contractors and temporary employees to augment their current workforce, respond to rising talent demands, staff large strategic projects, add new skills and expertise to their teams and accelerate growth.

The rising trend of contract labor is a global phenomenon. According to an Oxford Economics survey, 61% of executives reported an increase in the usage of contract labor to meet business objectives. What’s more, according to CareerBuilder’s Annual Jobs Forecast, 47% of employers are looking to hire part-time or contract workers.

It is not just organizations getting in on the contractor market, more and more professionals are opting to work as “free agents”. In fact, according to a Bureau of Labor Statistics report, 79% of independent contract employees preferred their arrangement over traditional employment.

While there are many types of freelance, SOW, consultant, temporary and contingent workers in a multitude of settings, in this article, we focus on the proper classification and management of independent contractors.

Co-Employment Risks and Considerations Associated with the Use of Independent Contractors

Leveraging the skills of independent contractors may provide many significant benefits, such as no income tax withholdings, no employment taxes, fewer employee liabilities and increased workforce agility. However, improper management and classification of independent contractors can result in co-employment and compliance issues.

What is Co-Employment?

When a contract employee has two employers whom both have potential legal responsibilities to them, that relationship is known as co-employment. Co-employment situations are common when independent contractors are hired through a staffing vendor because both the vendor and its client can claim an employer-employee relationship with the contractor.

In most cases, the staffing vendor is called the primary employer or employer of record. Co-employment risks occur when the client, or “secondary” employer, oversteps the bounds of the contractor-secondary employer relationship. Simply put, the client exercises more control over the contract employee than the laws and regulations permit.

Organizations who overstep their boundaries run the risk of taking on the role of the employer of record as determined by the IRS’s 20 Factor test. If an organization is deemed to be the employer of record, they then become responsible for all the tasks their staffing vendor has been performing.

For example, lawsuits connected to co-employment can result in an organization having to repay lost wages, overtime or benefits. In these cases, organizations may also be responsible for any associated court fees, which, since many of these cases are protracted over many years, can accrue over time.

A famous example of co-employment litigation related to hiring contract workers is the Vizcaino v. Microsoft Corp case. The court found that Microsoft failed to properly identify the roles of temporary workers, resulting in nearly $100 million in penalties.

Mitigating Co-Employment Risk

One way to avoid potential co-employment risk is to have a single point of contact for staffing vendor management. A Managed Service Provider (MSP) can act as this single point of contact. MSPs can mitigate co-employment risks by ensuring compliance and proper classification of 1099 workers. MSPs also mitigate risk related to workers themselves through conducting drug testing, background screening and skills assessments and determining worker eligibility.

Comprehensive MSP programs include pre-screening and onboarding best practices designed to drive compliance and mitigate co-employment risk and include drug testing, worker eligibility, skills assessments, wage rate, bill rate and performance ratings. Enterprise-wide independent contractor (1099) risk assessments enable MSP clients to understand their exposure and provide strategies for independent contractor replacement or migration to W-2 status when necessary. This can help alleviate the compliance concerns associated with hiring contract employees.

Managing Contract Employees

Engaging Your Contract Employee Workforce

Behavioral scientist Dr. Ashley Whillans from the Harvard Business School, who researches what makes people happy in the workplace, summarized the power of engagement succinctly: “Cash matters in people’s lives, but it’s not all that matters,” said Whillans. “What really matters in the workplace is helping employees feel appreciated.”

contract employee and hiring contract workers

To get the best from your contract workforce, your organization needs to treat contract workers with the same respect and appreciation you give to your full-time employees. Just like any worker, contractors value the opportunity to advance in their careers and take on challenging projects. Providing contract workers with opportunities to learn and grow as professionals can keep them satisfied and happy to work for your organization, and will encourage them to extend engagements rather than seeking new opportunities.

Improve the Contract Candidate Experience

While seeking new engagements, a contractor may review multiple opportunities a day. To stand apart from the crowd, clearly articulate what makes your contract opportunity worth their time. This will make it easier for them to quickly assess whether the opportunity is a good fit and, if so, motivate them to toss their hat in the ring. For example, job postings for contract positions should be more precise and to the point. Try not to include a long list of rigid experience qualifications and responsibilities.

Contractors’ hiring experience can be very different from full-time employees. Therefore, don’t use the same process to recruit and onboard them. Instead, develop and employ a consistent onboarding process designed solely for independent contract workers to improve their candidate experience.

Integrating Contract Workers into Your Team

contract workers

For your contract workforce to be effective, your leadership should go above and beyond to ensure that members feel welcome and are properly integrated into the larger organizational culture. A worker’s hiring status should not preclude them from feeling like they are a part of the team. In other words, make sure all your contract workers know that they are valued contributors.

What’s more, treating contract employees like “second class citizens” can result in bad morale, not just with your contractors, but also your permanent workforce who work beside them. Organizations can find a myriad of ways to welcome them into the corporate culture while avoiding co-employment risk such as:

  • Involve contractors in all relevant meetings
  • Include them on team email lists
  • Solicit their opinions and ideas for process improvement
  • Remember contract employees when you celebrate project milestones

Remember, contract workers have more than likely been a part of many projects and organizations across industries. So, by properly integrating them into your team you are also integrating the collected wisdom and perspectives of multiple organizations and industries.

Communication

Establishing good communication is the key to maintaining strong relationships between contractors and employers. The first step in establishing good communication is letting your contracted team members know that you are always available to answer questions and address concerns.

You should hold regular meetings with members of your contract staff to stay updated about the progress and obstacles they might be facing on projects. You can also assign each contractor a point person they can go to when questions arise, or they are unclear about their assignment.

Video calls, chat messages and emails are all great ways to keep in touch—especially if the worker is remote—but do not rely too heavily on technology to communicate; just like with your full-time employees, contract workers who work on-site like to have personal and face-to-face communications with their employer.

Onboarding Contract Employees

Hiring contract workers

Walking into an unfamiliar office, parsing out the dos and don’ts of a new workplace, and locating the restrooms and water coolers can be daunting on the first day of a new job. So, imagine a contractor who may have to go through this process multiple times a year, as they move from assignment to assignment. This is where providing a seamless onboarding process to contract hires can help reduce the stress related to starting a new assignment and establish trust and comfort from day one.

During the contractor onboarding process, make sure you have everything prepared on a worker’s first day. Security badges, equipment, office supplies and access to the information required to navigate projects should all be ready to go once they enter the door.

While the onboarding process for contractors will and should look different from an administrative perspective, it should be an equally positive experience. Every employee, once onboarded, should feel as much a part of the team as anyone. Doing so will promote trust in the workplace and will ultimately lead to more creativity and production across the board.

Fostering Relationships

Workers—regardless of employment status—are more effective and productive when they have strong relationships with their colleagues. According to research conducted by Gallup, employees who report having a best friend at work constantly perform better than employees without similar connections.

When workers respect and view their colleagues as friends, they are more likely to value each other’s input and ideas and may feel more comfortable sharing their own. This mutual respect and comradery lead to better teamwork and the development of solutions based on the collective insight, wisdom and creativity of the whole team.

Early on in an assignment, introduce your contractors to each other and their full-time counterparts. During the initial meeting, encourage everyone to share their background, experience, personal achievements and interests. This can help build rapport and engender greater trust and cooperation.

Tracking and Supervising Projects Assigned to a Contract Employee

Managers who oversee contract employees do so without a formal supervisor-employee hierarchical relationship. They can specify what projects need to be done and when they need to be completed. However, they cannot dictate the specific hours that contractors work or exactly how they are to perform the work. So, to effectively manage projects assigned to a contract employee, managers need to employ a more hands-off supervisory approach.

Define your Goals, Expectations and Timelines with Your Contract Employee

Before assigning a project or task, you should discuss the goals of the project, the contractor’s role in it and what you expect from them. You can avoid future confusion about when they should complete tasks by sketching out a clear timeline of when the project starts when they should report on the progress and when they have to turnover in the final product.

Check-in Regularly

A good way of checking up on project status is to schedule intermittent check-ins with your contract employees to gauge progress toward goals and objectives. While checking-in, do not explicitly direct your contract employee’s actions, as this may run the risk of employee misclassification and run afoul of co-employment regulations. Think of it as managing for results rather than specific activities.

Evaluate and Review

Just like your permanent employees, contract workers need constructive feedback to improve on their skills. When a contractor submits a task, evaluate it right away and provide speedy feedback. This will not only help them review their work, but you can also check on whether the project that you assigned the worker is on the right track or if it needs a course correction.

Conclusion

As more and more professionals are choosing to make their living working as contract employees, the contract employee workforce is becoming a bigger part of the labor mix. Developing a best practice management strategy is essential in attracting and retaining them and is required for optimizing organizational growth.

Forward-thinking organizations are providing contracted workers with a greater say in the work they do; they’re connecting them with teammates and they’re recognizing them for their contributions. In other words, they’re positioning themselves to become employers of choice for contractors.

PeopleScout U.S. Jobs Report Analysis — July 2019

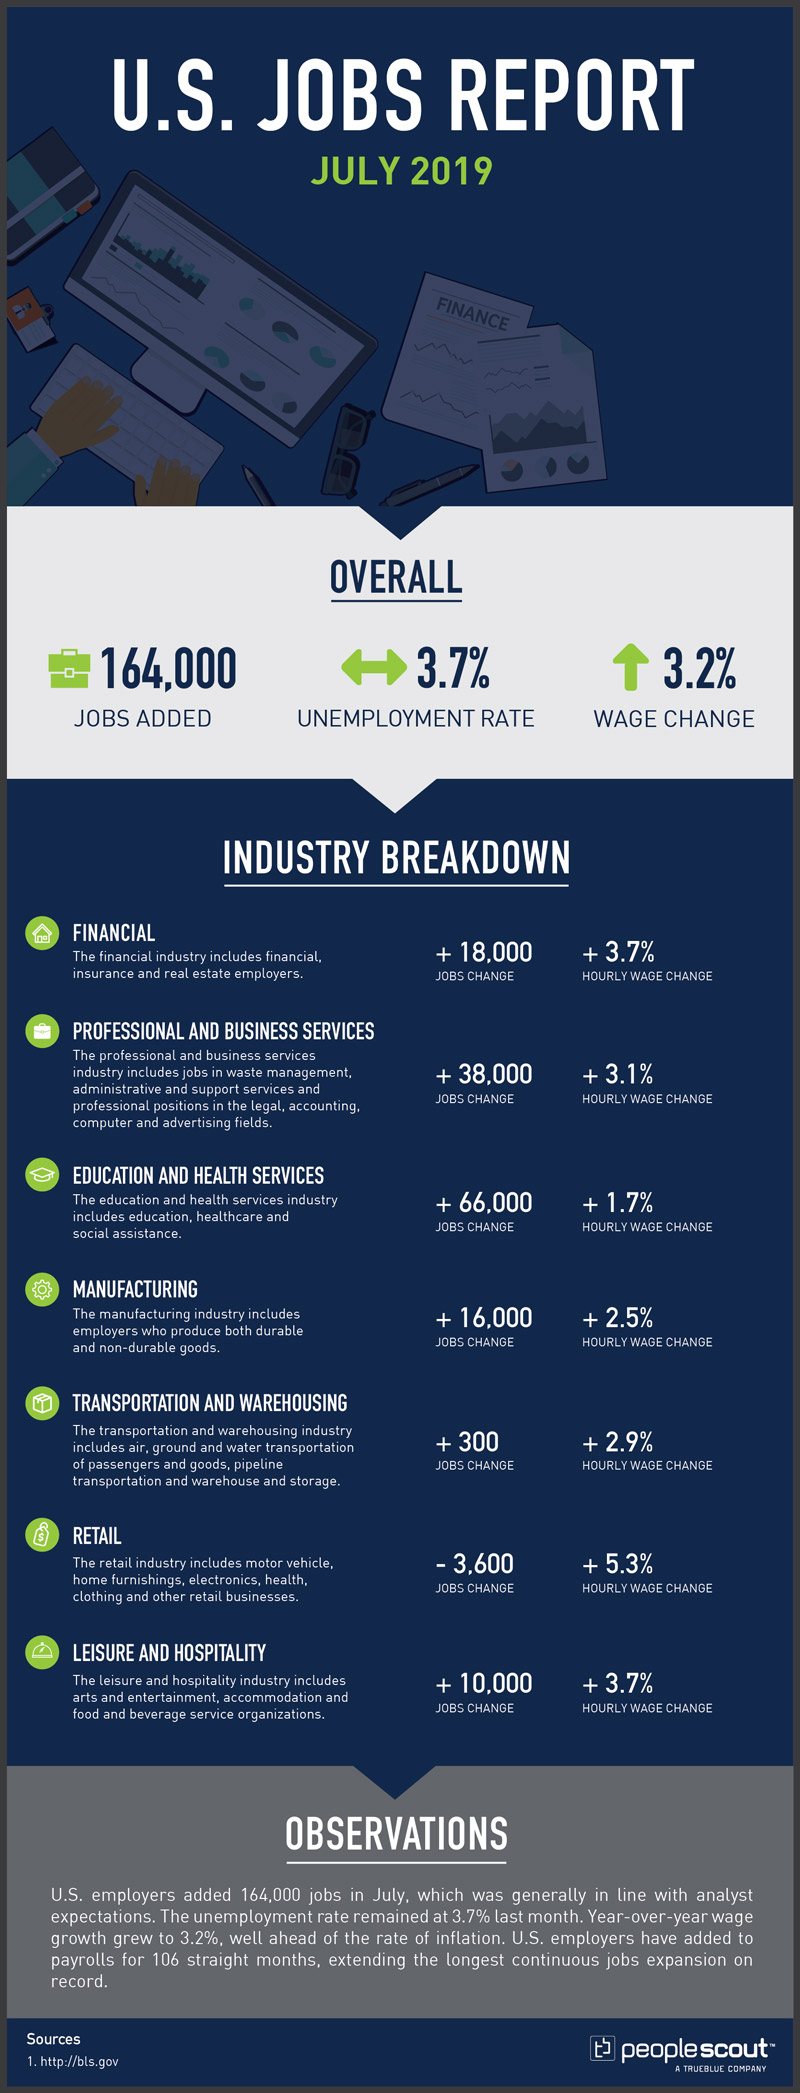
The Labor Department released its July jobs report which shows that U.S. employers added 164,000 jobs in July, in line with many analyst expectations. The unemployment rate stayed at  3.7%. Year-over-year wage growth grew to 3.2%, well ahead of the rate of inflation. U.S. employers have added to payrolls for 106 straight months, extending the longest continuous jobs expansion on record.

us jobs report infographic

The Numbers

164,000: The economy added 164,000 jobs in July.

3.7%: The unemployment rate remained at 3.7%.

3.2%: Wages increased at a rate of 3.2% over the last year.

The Good

The longest continuous job expansion in the nation’s history extended another month with 164,000 new jobs added to the economy. The unemployment rate remained at 3.7%, a figure close to historic lows. Year-over-year earnings increased to a healthy 3.2%.

There was also good news for those who were working part-time out of economic necessity. The number of persons employed part-time for economic reasons (sometimes referred to as involuntary part-time workers) declined by 363,000 in July to 4.0 million. These individuals, who would have preferred full-time employment, were working part-time because their hours had been reduced or they were unable to find full-time jobs. Over the past 12 months, the number of involuntary part-time workers has declined by an impressive 604,000.

Among the marginally attached, there were 368,000 discouraged workers in July, down by 144,000 from a year earlier. Discouraged workers are those not currently looking for work because they believe no jobs are available for them. The remaining 1.1 million persons marginally attached to the labor force in July had not searched for work for reasons such as school attendance or family responsibilities. The decrease in discouraged workers reflects that confidence that enough jobs have been created to lure these individuals back into the workforce.

The Bad

The rate of job growth is definitely slowing. Over the first seven months of the year, the economy added 165,000 jobs a month, on average, below 2018’s average monthly pace of 223,000. The July report also shows a fall in the number of hours worked. The average workweek for all employees on private nonfarm payrolls decreased by 0.1 hour to 34.3 hours in July. In manufacturing, the average workweek decreased by 0.3 hour to 40.4 hours, and overtime declined by 0.2 hour to 3.2 hours. The decline in manufacturing hours can be attributed to uncertainty caused by the tariffs on foreign goods which have been growing on key trading partners like China.

While this slowing rate of growth may not be a cause for concern, the slowing rate combined with reduced hours has provoked pessimistic responses from some analysts:

“If I were to give a grade to the July employment report it would be a gentlemen’s C: Three-month average has declined to 140K, the downward revisions to May and June, and that decline in hours worked, which impacts your median household, is not encouraging.”

The Unknown

While 106 months of continuous job expansion is certainly viewed as good news for American workers, this extended job growth has increased competition among employers for increasingly scarce talent. One sector that has been most impacted by the tight labor market is hospitality. As the New York Times reported on the challenges employers face as part of its reporting on the July jobs report:

“A survey of business owners last month by the National Federation of Independent Business found job creation remains at a historically high level.

Ask pretty much any general contractor, hospital leader or restaurant owner about his or her biggest headaches, and a lack of qualified workers comes up.

‘Ten percent of our positions are always open,’ said Ignacio Garcia-Menocal, a co-founder and chief executive of Grove Bay Hospitality, which operates several celebrity-chef restaurants and employs 450 people. With two restaurants opening soon, Mr. Garcia-Menocal said he was looking to hire 40 to 50 people, from dishwashers who start at $10 an hour to general managers, whose salaries can range from $70,000 to $90,000 a year.”

It is unclear how long many businesses can continue operating normally with job vacancy rates at 10% or even higher. In the short term, these businesses could incur higher overtime costs and increased wage demands as they ask their employees to perform at greater efficiency. In the long-term, many enterprises will need to re-think their recruitment and retention strategies if they want to remain profitable in the most challenging labor market in recent memory.

PeopleScout Australia Jobs Report Analysis – June 2019

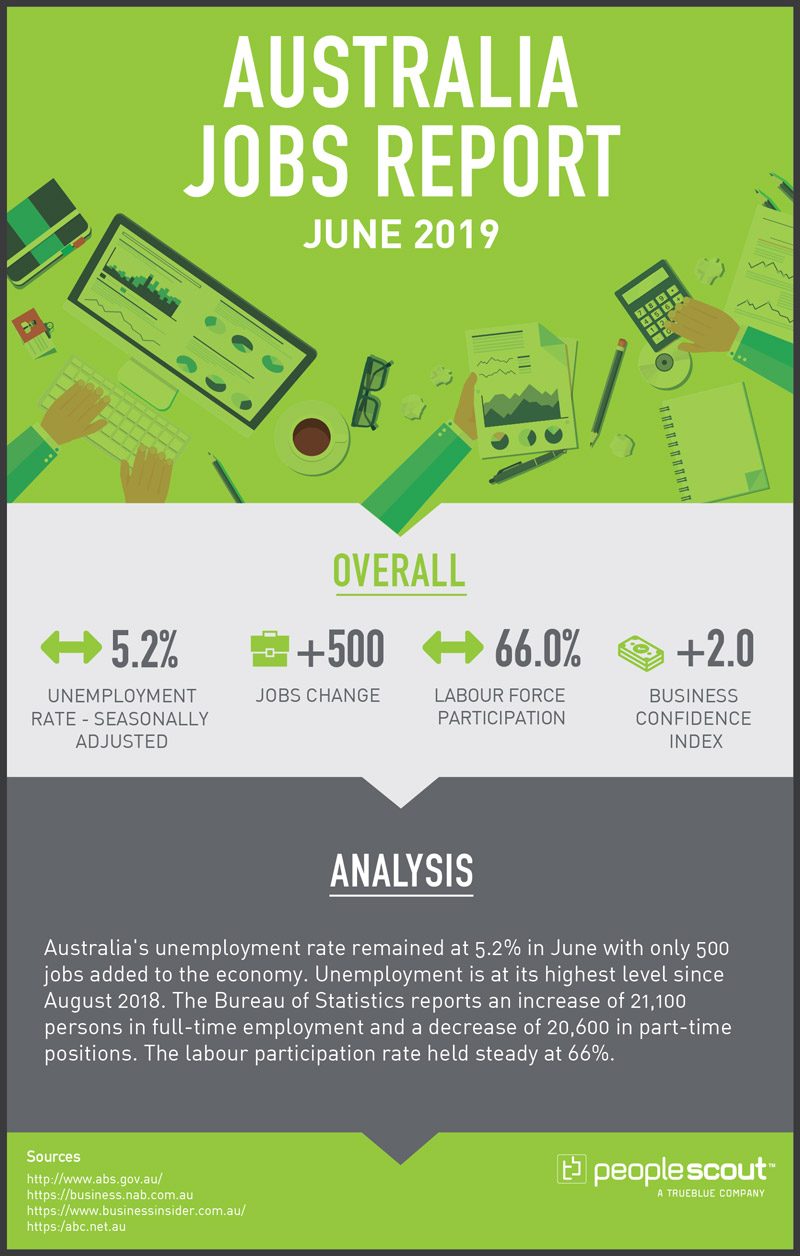
Australia’s unemployment rate remained at 5.2% in June with only 500 jobs added to the economy. Unemployment is at its highest level since August 2018. The Bureau of Statistics reports an increase of 21,100 persons in full-time employment and a decrease of 20,600 in part-time positions. The labour participation rate held steady at 66%.

June 2019 (July Report)  Unemployment rate – Seasonally Adjusted: 5.2 percent (Sideways Arrow) Jobs Change: + 500 Labour Force Participation: 66.0 per cent (Sideways Arrow)   Business Confidence Index: +2 (Down Arrow)  Sources:  http://www.abs.gov.au/ https://business.nab.com.au https://www.businessinsider.com.au/ https:/abc.net.au https://business.nab.com.au/  Summary:  Australia's unemployment rate remained at 5.2% in June with only 500 jobs added to the economy. Unemployment is at its highest level since August 2018. The Bureau of Statistics reports an increase of 21,100 persons in full-time employment and a decrease of 20,600 in part-time positions. The labour participation rate held steady at 66%.

Numbers

500: The Australian economy added 500 jobs in June.

5.2%: The Australian unemployment rate remained at 5.2%.

66.0%: Labour force participation stayed at 66.0%.

+2: The Business Confident Index fell to +2 in the latest NAB release.

Upside

The headline of only 500 jobs added in June masks the good news that 21,100 full-time positions were created balanced by the loss of 20,600 part-time positions. At 66%, approximately two-thirds of the Australian population is now participating in the workforce, up 0.3 percentage points from a year ago. 

The underemployment rate which includes those who are working part-time but want full-time employment and full-time workers whose jobs were unable to provide full-time work hours dropped 0.4 percentage points to 8.2% in June. Western Australia had a significant gain of 13,800 jobs.

Downside

Every state except Western Australia posted job losses in June. The largest decreases were in New South Wales down 17,400, followed by Queensland, which lost 8,200, South Australia, which decreased by 4,700, and Victoria, which lost 4,100. Unemployment was at 4.9% in February, and it has been higher ever since. 

The lackluster job growth combined with other factors is causing some analysts, such as AMP Chief Economist Shane Oliver to forecast limited expansion of the labour market in the near term:

 “We see a further slowdown in jobs growth over the next six months,” Oliver said, citing a slowing in jobs ads, vacancies and hiring plans.

Job Opportunities and Candidates Not Aligned

A recent study by the global employment site Indeed reports that the titles of Australian job seekers were aligned with the jobs being posted only about 50% of the time and that Australia has a higher mismatch rate than the United States or the UK. This disparity was measured by comparing the titles on the active job seekers’ resumes and the titles of the jobs that are posted. In contrast to the mismatch of nearly half of the Australian job seekers, the figures showed comparable mismatches in the UK of 40%, approximately one third in the United States and less than one third in Canada.

One reason for this significant gap in Australia is that the “job mix” has changed rapidly in recent years. Job mix can be defined as the job titles and the number of those holding these titles in a given economy.

Indeed’s Asia Pacific Economist Calliam Pickering noted, “Australia’s labour market is evolving, with the job mix 22% different in December 2018 than in January 2014.”

Pickering warned that the evolution of Australia’s job mix could result in skills shortages, which could harm both job seekers and employers:

“Businesses may lower expectations for skills or experience, while job seekers might accept positions that fail to fully utilise their skills or education,” he said.

The report presents a scenario in which roughly half of Australian job seekers may not have the skills or experience to succeed in the current job market. This suggests that Australian employers cannot rely on their traditional recruitment strategies and should actively seek out expertise from organisations like recruitment process outsourcers to attract the right talent in a rapidly changing environment.